

17 Basic Ecosystem Dynamics in the Red Sea as Seen by Sundry . . .
345
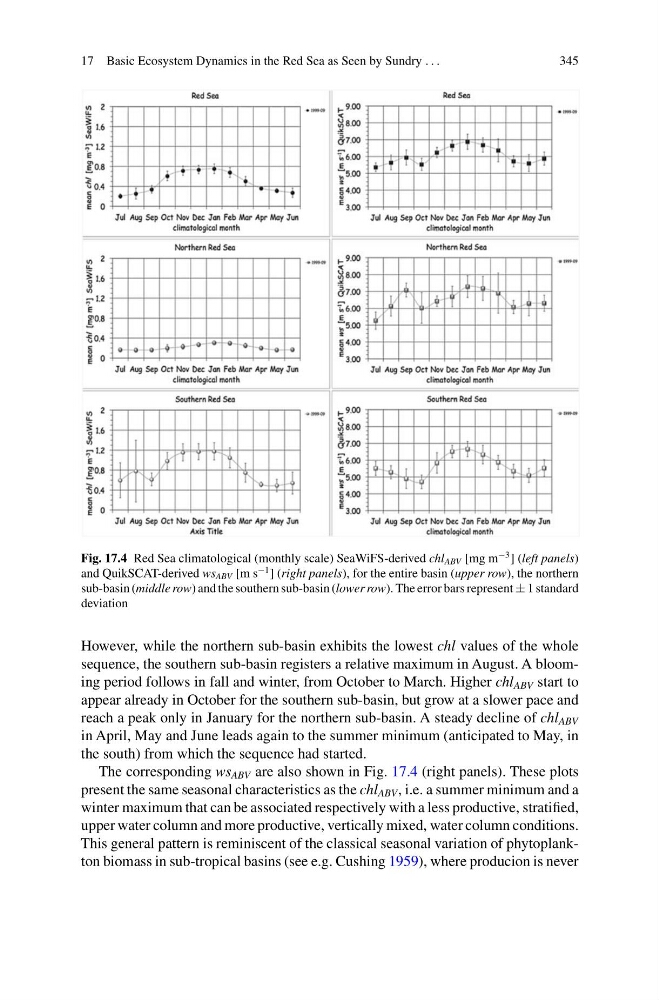
Fig. 17.4 Red Sea climatological (monthly scale) SeaWiFS-derived chl ABV [mg m
−3 ] (left panels)
and QuikSCAT-derived ws ABV [m s
−1 ] (right panels), for the entire basin (upper row), the northern
sub-basin (middle row) and the southern sub-basin (lower row). The error bars represent ± 1 standard
deviation
However, while the northern sub-basin exhibits the lowest chl values of the whole
sequence, the southern sub-basin registers a relative maximum in August. A blooming period follows in fall and winter, from October to March. Higher chl ABV start to
appear already in October for the southern sub-basin, but grow at a slower pace and
reach a peak only in January for the northern sub-basin. A steady decline of chl ABV
in April, May and June leads again to the summer minimum (anticipated to May, in
the south) from which the sequence had started.
The corresponding ws ABV are also shown in Fig. 17.4 (right panels). These plots
present the same seasonal characteristics as the chl ABV , i.e. a summer minimum and a
winter maximum that can be associated respectively with a less productive, stratified,
upper water column and more productive, vertically mixed, water column conditions.
This general pattern is reminiscent of the classical seasonal variation of phytoplankton biomass in sub-tropical basins (see e.g. Cushing 1959), where producion is never
345
Fig. 17.4 Red Sea climatological (monthly scale) SeaWiFS-derived chl ABV [mg m
−3 ] (left panels)
and QuikSCAT-derived ws ABV [m s
−1 ] (right panels), for the entire basin (upper row), the northern
sub-basin (middle row) and the southern sub-basin (lower row). The error bars represent ± 1 standard
deviation
However, while the northern sub-basin exhibits the lowest chl values of the whole
sequence, the southern sub-basin registers a relative maximum in August. A blooming period follows in fall and winter, from October to March. Higher chl ABV start to
appear already in October for the southern sub-basin, but grow at a slower pace and
reach a peak only in January for the northern sub-basin. A steady decline of chl ABV
in April, May and June leads again to the summer minimum (anticipated to May, in
the south) from which the sequence had started.
The corresponding ws ABV are also shown in Fig. 17.4 (right panels). These plots
present the same seasonal characteristics as the chl ABV , i.e. a summer minimum and a
winter maximum that can be associated respectively with a less productive, stratified,
upper water column and more productive, vertically mixed, water column conditions.
This general pattern is reminiscent of the classical seasonal variation of phytoplankton biomass in sub-tropical basins (see e.g. Cushing 1959), where producion is never