

302
S. Lehner et al.
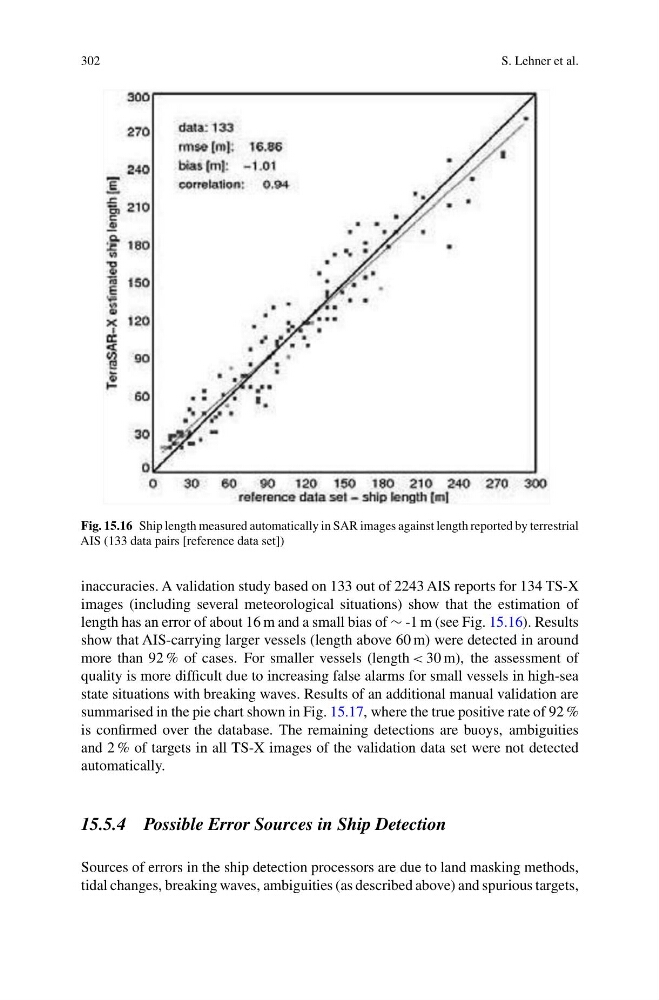
Fig. 15.16 Ship length measured automatically in SAR images against length reported by terrestrial
AIS (133 data pairs [reference data set])
inaccuracies. A validation study based on 133 out of 2243 AIS reports for 134 TS-X
images (including several meteorological situations) show that the estimation of
length has an error of about 16 m and a small bias of ∼ -1 m (see Fig. 15.16). Results
show that AIS-carrying larger vessels (length above 60 m) were detected in around
more than 92 % of cases. For smaller vessels (length < 30 m), the assessment of
quality is more difficult due to increasing false alarms for small vessels in high-sea
state situations with breaking waves. Results of an additional manual validation are
summarised in the pie chart shown in Fig. 15.17, where the true positive rate of 92 %
is confirmed over the database. The remaining detections are buoys, ambiguities
and 2 % of targets in all TS-X images of the validation data set were not detected
automatically.
15.5.4 Possible Error Sources in Ship Detection
Sources of errors in the ship detection processors are due to land masking methods,
tidal changes, breaking waves, ambiguities (as described above) and spurious targets,
S. Lehner et al.
Fig. 15.16 Ship length measured automatically in SAR images against length reported by terrestrial
AIS (133 data pairs [reference data set])
inaccuracies. A validation study based on 133 out of 2243 AIS reports for 134 TS-X
images (including several meteorological situations) show that the estimation of
length has an error of about 16 m and a small bias of ∼ -1 m (see Fig. 15.16). Results
show that AIS-carrying larger vessels (length above 60 m) were detected in around
more than 92 % of cases. For smaller vessels (length < 30 m), the assessment of
quality is more difficult due to increasing false alarms for small vessels in high-sea
state situations with breaking waves. Results of an additional manual validation are
summarised in the pie chart shown in Fig. 15.17, where the true positive rate of 92 %
is confirmed over the database. The remaining detections are buoys, ambiguities
and 2 % of targets in all TS-X images of the validation data set were not detected
automatically.
15.5.4 Possible Error Sources in Ship Detection
Sources of errors in the ship detection processors are due to land masking methods,
tidal changes, breaking waves, ambiguities (as described above) and spurious targets,