

14 Internal Solitary Waves System in the Mozambique Channel
269
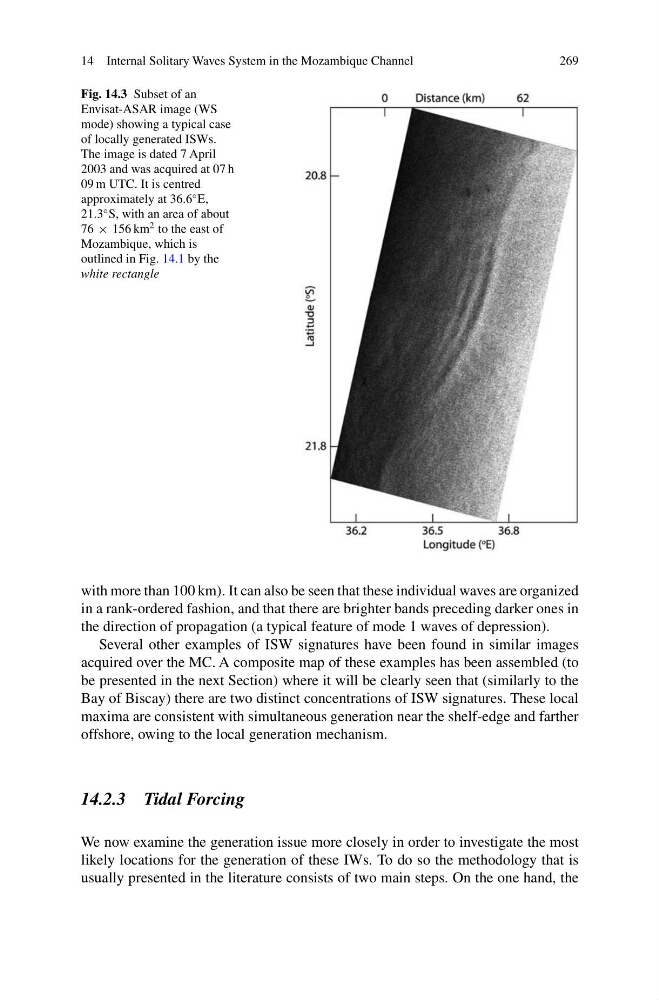
Fig. 14.3 Subset of an
Envisat-ASAR image (WS
mode) showing a typical case
of locally generated ISWs.
The image is dated 7 April
2003 and was acquired at 07 h
09 m UTC. It is centred
approximately at 36.6
◦ E,
21.3
◦ S, with an area of about
76 × 156 km
2 to the east of
Mozambique, which is
outlined in Fig. 14.1 by the
white rectangle
with more than 100 km). It can also be seen that these individual waves are organized
in a rank-ordered fashion, and that there are brighter bands preceding darker ones in
the direction of propagation (a typical feature of mode 1 waves of depression).
Several other examples of ISW signatures have been found in similar images
acquired over the MC. A composite map of these examples has been assembled (to
be presented in the next Section) where it will be clearly seen that (similarly to the
Bay of Biscay) there are two distinct concentrations of ISW signatures. These local
maxima are consistent with simultaneous generation near the shelf-edge and farther
offshore, owing to the local generation mechanism.
14.2.3 Tidal Forcing
We now examine the generation issue more closely in order to investigate the most
likely locations for the generation of these IWs. To do so the methodology that is
usually presented in the literature consists of two main steps. On the one hand, the
269
Fig. 14.3 Subset of an
Envisat-ASAR image (WS
mode) showing a typical case
of locally generated ISWs.
The image is dated 7 April
2003 and was acquired at 07 h
09 m UTC. It is centred
approximately at 36.6
◦ E,
21.3
◦ S, with an area of about
76 × 156 km
2 to the east of
Mozambique, which is
outlined in Fig. 14.1 by the
white rectangle
with more than 100 km). It can also be seen that these individual waves are organized
in a rank-ordered fashion, and that there are brighter bands preceding darker ones in
the direction of propagation (a typical feature of mode 1 waves of depression).
Several other examples of ISW signatures have been found in similar images
acquired over the MC. A composite map of these examples has been assembled (to
be presented in the next Section) where it will be clearly seen that (similarly to the
Bay of Biscay) there are two distinct concentrations of ISW signatures. These local
maxima are consistent with simultaneous generation near the shelf-edge and farther
offshore, owing to the local generation mechanism.
14.2.3 Tidal Forcing
We now examine the generation issue more closely in order to investigate the most
likely locations for the generation of these IWs. To do so the methodology that is
usually presented in the literature consists of two main steps. On the one hand, the