

268
J. M. Magalhaes et al.
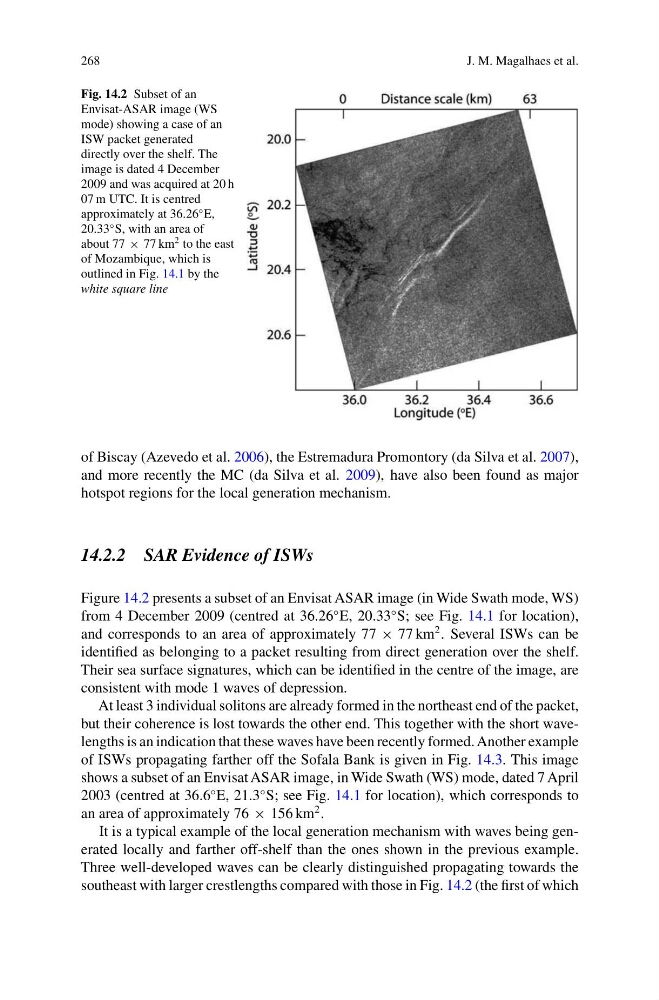
Fig. 14.2 Subset of an
Envisat-ASAR image (WS
mode) showing a case of an
ISW packet generated
directly over the shelf. The
image is dated 4 December
2009 and was acquired at 20 h
07 m UTC. It is centred
approximately at 36.26
◦ E,
20.33
◦ S, with an area of
about 77 × 77 km
2 to the east
of Mozambique, which is
outlined in Fig. 14.1 by the
white square line
of Biscay (Azevedo et al. 2006), the Estremadura Promontory (da Silva et al. 2007),
and more recently the MC (da Silva et al. 2009), have also been found as major
hotspot regions for the local generation mechanism.
14.2.2 SAR Evidence of ISWs
Figure 14.2 presents a subset of an Envisat ASAR image (in Wide Swath mode, WS)
from 4 December 2009 (centred at 36.26
◦ E, 20.33
◦ S; see Fig. 14.1 for location),
and corresponds to an area of approximately 77 × 77 km
2 . Several ISWs can be
identified as belonging to a packet resulting from direct generation over the shelf.
Their sea surface signatures, which can be identified in the centre of the image, are
consistent with mode 1 waves of depression.
At least 3 individual solitons are already formed in the northeast end of the packet,
but their coherence is lost towards the other end. This together with the short wavelengths is an indication that these waves have been recently formed. Another example
of ISWs propagating farther off the Sofala Bank is given in Fig. 14.3. This image
shows a subset of an Envisat ASAR image, in Wide Swath (WS) mode, dated 7 April
2003 (centred at 36.6
◦ E, 21.3
◦ S; see Fig. 14.1 for location), which corresponds to
an area of approximately 76 × 156 km
2 .
It is a typical example of the local generation mechanism with waves being generated locally and farther off-shelf than the ones shown in the previous example.
Three well-developed waves can be clearly distinguished propagating towards the
southeast with larger crestlengths compared with those in Fig. 14.2 (the first of which
J. M. Magalhaes et al.
Fig. 14.2 Subset of an
Envisat-ASAR image (WS
mode) showing a case of an
ISW packet generated
directly over the shelf. The
image is dated 4 December
2009 and was acquired at 20 h
07 m UTC. It is centred
approximately at 36.26
◦ E,
20.33
◦ S, with an area of
about 77 × 77 km
2 to the east
of Mozambique, which is
outlined in Fig. 14.1 by the
white square line
of Biscay (Azevedo et al. 2006), the Estremadura Promontory (da Silva et al. 2007),
and more recently the MC (da Silva et al. 2009), have also been found as major
hotspot regions for the local generation mechanism.
14.2.2 SAR Evidence of ISWs
Figure 14.2 presents a subset of an Envisat ASAR image (in Wide Swath mode, WS)
from 4 December 2009 (centred at 36.26
◦ E, 20.33
◦ S; see Fig. 14.1 for location),
and corresponds to an area of approximately 77 × 77 km
2 . Several ISWs can be
identified as belonging to a packet resulting from direct generation over the shelf.
Their sea surface signatures, which can be identified in the centre of the image, are
consistent with mode 1 waves of depression.
At least 3 individual solitons are already formed in the northeast end of the packet,
but their coherence is lost towards the other end. This together with the short wavelengths is an indication that these waves have been recently formed. Another example
of ISWs propagating farther off the Sofala Bank is given in Fig. 14.3. This image
shows a subset of an Envisat ASAR image, in Wide Swath (WS) mode, dated 7 April
2003 (centred at 36.6
◦ E, 21.3
◦ S; see Fig. 14.1 for location), which corresponds to
an area of approximately 76 × 156 km
2 .
It is a typical example of the local generation mechanism with waves being generated locally and farther off-shelf than the ones shown in the previous example.
Three well-developed waves can be clearly distinguished propagating towards the
southeast with larger crestlengths compared with those in Fig. 14.2 (the first of which