

11 Satellite Observations of Oceanic Eddies Around Africa
223
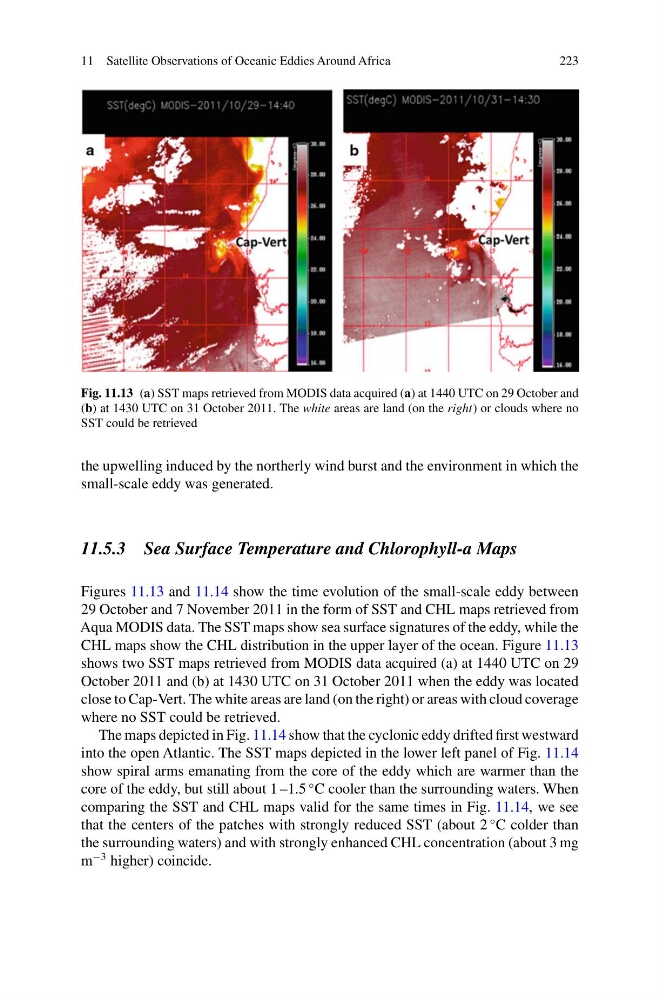
Fig. 11.13 (a) SST maps retrieved from MODIS data acquired (a) at 1440 UTC on 29 October and
(b) at 1430 UTC on 31 October 2011. The white areas are land (on the right) or clouds where no
SST could be retrieved
the upwelling induced by the northerly wind burst and the environment in which the
small-scale eddy was generated.
11.5.3 Sea Surface Temperature and Chlorophyll-a Maps
Figures 11.13 and 11.14 show the time evolution of the small-scale eddy between
29 October and 7 November 2011 in the form of SST and CHL maps retrieved from
Aqua MODIS data. The SST maps show sea surface signatures of the eddy, while the
CHL maps show the CHL distribution in the upper layer of the ocean. Figure 11.13
shows two SST maps retrieved from MODIS data acquired (a) at 1440 UTC on 29
October 2011 and (b) at 1430 UTC on 31 October 2011 when the eddy was located
close to Cap-Vert. The white areas are land (on the right) or areas with cloud coverage
where no SST could be retrieved.
The maps depicted in Fig. 11.14 show that the cyclonic eddy drifted first westward
into the open Atlantic. The SST maps depicted in the lower left panel of Fig. 11.14
show spiral arms emanating from the core of the eddy which are warmer than the
core of the eddy, but still about 1 –1.5
◦ C cooler than the surrounding waters. When
comparing the SST and CHL maps valid for the same times in Fig. 11.14, we see
that the centers of the patches with strongly reduced SST (about 2
◦ C colder than
the surrounding waters) and with strongly enhanced CHL concentration (about 3 mg
m
−3 higher) coincide.
223
Fig. 11.13 (a) SST maps retrieved from MODIS data acquired (a) at 1440 UTC on 29 October and
(b) at 1430 UTC on 31 October 2011. The white areas are land (on the right) or clouds where no
SST could be retrieved
the upwelling induced by the northerly wind burst and the environment in which the
small-scale eddy was generated.
11.5.3 Sea Surface Temperature and Chlorophyll-a Maps
Figures 11.13 and 11.14 show the time evolution of the small-scale eddy between
29 October and 7 November 2011 in the form of SST and CHL maps retrieved from
Aqua MODIS data. The SST maps show sea surface signatures of the eddy, while the
CHL maps show the CHL distribution in the upper layer of the ocean. Figure 11.13
shows two SST maps retrieved from MODIS data acquired (a) at 1440 UTC on 29
October 2011 and (b) at 1430 UTC on 31 October 2011 when the eddy was located
close to Cap-Vert. The white areas are land (on the right) or areas with cloud coverage
where no SST could be retrieved.
The maps depicted in Fig. 11.14 show that the cyclonic eddy drifted first westward
into the open Atlantic. The SST maps depicted in the lower left panel of Fig. 11.14
show spiral arms emanating from the core of the eddy which are warmer than the
core of the eddy, but still about 1 –1.5
◦ C cooler than the surrounding waters. When
comparing the SST and CHL maps valid for the same times in Fig. 11.14, we see
that the centers of the patches with strongly reduced SST (about 2
◦ C colder than
the surrounding waters) and with strongly enhanced CHL concentration (about 3 mg
m
−3 higher) coincide.