

224
W. Alpers et al.
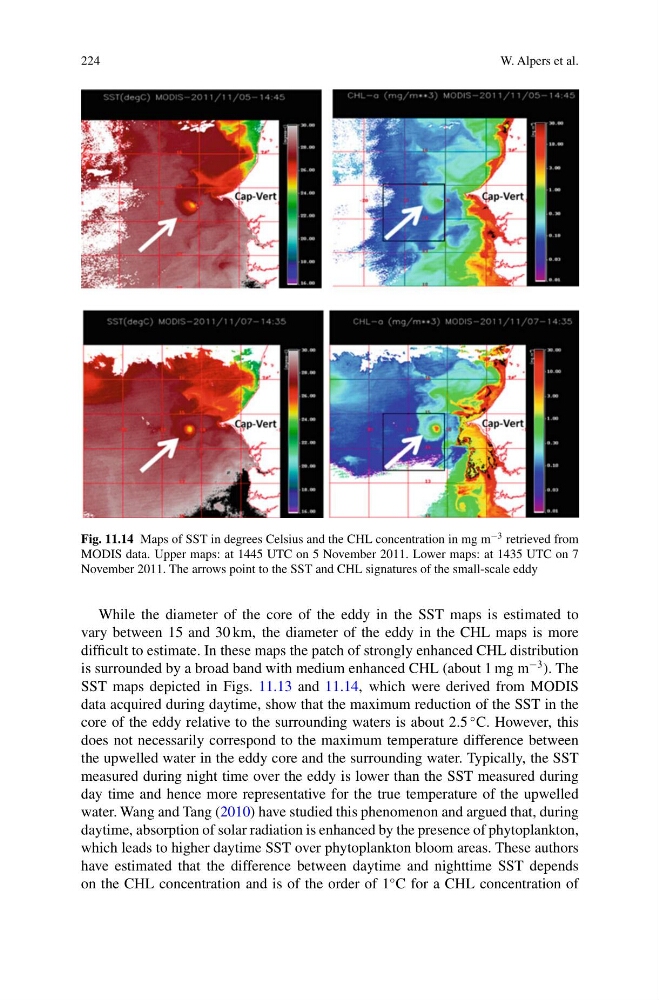
Fig. 11.14 Maps of SST in degrees Celsius and the CHL concentration in mg m
−3 retrieved from
MODIS data. Upper maps: at 1445 UTC on 5 November 2011. Lower maps: at 1435 UTC on 7
November 2011. The arrows point to the SST and CHL signatures of the small-scale eddy
While the diameter of the core of the eddy in the SST maps is estimated to
vary between 15 and 30 km, the diameter of the eddy in the CHL maps is more
difficult to estimate. In these maps the patch of strongly enhanced CHL distribution
is surrounded by a broad band with medium enhanced CHL (about 1 mg m
−3 ). The
SST maps depicted in Figs. 11.13 and 11.14, which were derived from MODIS
data acquired during daytime, show that the maximum reduction of the SST in the
core of the eddy relative to the surrounding waters is about 2.5
◦ C. However, this
does not necessarily correspond to the maximum temperature difference between
the upwelled water in the eddy core and the surrounding water. Typically, the SST
measured during night time over the eddy is lower than the SST measured during
day time and hence more representative for the true temperature of the upwelled
water. Wang and Tang (2010) have studied this phenomenon and argued that, during
daytime, absorption of solar radiation is enhanced by the presence of phytoplankton,
which leads to higher daytime SST over phytoplankton bloom areas. These authors
have estimated that the difference between daytime and nighttime SST depends
on the CHL concentration and is of the order of 1
◦ C for a CHL concentration of
W. Alpers et al.
Fig. 11.14 Maps of SST in degrees Celsius and the CHL concentration in mg m
−3 retrieved from
MODIS data. Upper maps: at 1445 UTC on 5 November 2011. Lower maps: at 1435 UTC on 7
November 2011. The arrows point to the SST and CHL signatures of the small-scale eddy
While the diameter of the core of the eddy in the SST maps is estimated to
vary between 15 and 30 km, the diameter of the eddy in the CHL maps is more
difficult to estimate. In these maps the patch of strongly enhanced CHL distribution
is surrounded by a broad band with medium enhanced CHL (about 1 mg m
−3 ). The
SST maps depicted in Figs. 11.13 and 11.14, which were derived from MODIS
data acquired during daytime, show that the maximum reduction of the SST in the
core of the eddy relative to the surrounding waters is about 2.5
◦ C. However, this
does not necessarily correspond to the maximum temperature difference between
the upwelled water in the eddy core and the surrounding water. Typically, the SST
measured during night time over the eddy is lower than the SST measured during
day time and hence more representative for the true temperature of the upwelled
water. Wang and Tang (2010) have studied this phenomenon and argued that, during
daytime, absorption of solar radiation is enhanced by the presence of phytoplankton,
which leads to higher daytime SST over phytoplankton bloom areas. These authors
have estimated that the difference between daytime and nighttime SST depends
on the CHL concentration and is of the order of 1
◦ C for a CHL concentration of