

222
W. Alpers et al.
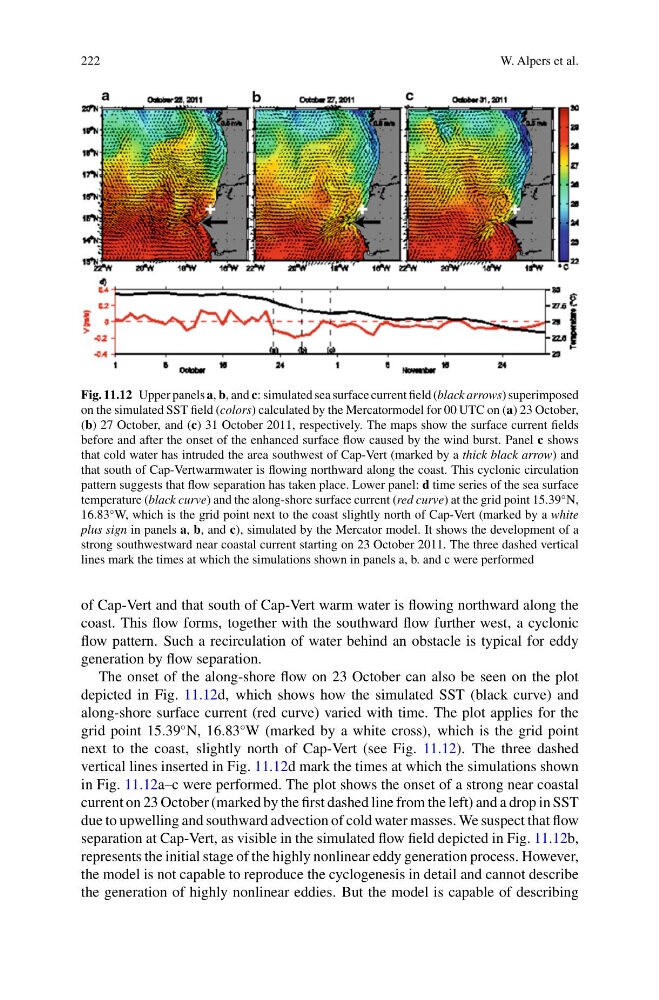
Fig. 11.12 Upper panels a, b, and c: simulated sea surface current field (black arrows) superimposed
on the simulated SST field (colors) calculated by the Mercatormodel for 00 UTC on (a) 23 October,
(b) 27 October, and (c) 31 October 2011, respectively. The maps show the surface current fields
before and after the onset of the enhanced surface flow caused by the wind burst. Panel c shows
that cold water has intruded the area southwest of Cap-Vert (marked by a thick black arrow) and
that south of Cap-Vertwarmwater is flowing northward along the coast. This cyclonic circulation
pattern suggests that flow separation has taken place. Lower panel: d time series of the sea surface
temperature (black curve) and the along-shore surface current (red curve) at the grid point 15.39
◦ N,
16.83
◦ W, which is the grid point next to the coast slightly north of Cap-Vert (marked by a white
plus sign in panels a, b, and c), simulated by the Mercator model. It shows the development of a
strong southwestward near coastal current starting on 23 October 2011. The three dashed vertical
lines mark the times at which the simulations shown in panels a, b. and c were performed
of Cap-Vert and that south of Cap-Vert warm water is flowing northward along the
coast. This flow forms, together with the southward flow further west, a cyclonic
flow pattern. Such a recirculation of water behind an obstacle is typical for eddy
generation by flow separation.
The onset of the along-shore flow on 23 October can also be seen on the plot
depicted in Fig. 11.12d, which shows how the simulated SST (black curve) and
along-shore surface current (red curve) varied with time. The plot applies for the
grid point 15.39
◦ N, 16.83
◦ W (marked by a white cross), which is the grid point
next to the coast, slightly north of Cap-Vert (see Fig. 11.12). The three dashed
vertical lines inserted in Fig. 11.12d mark the times at which the simulations shown
in Fig. 11.12a–c were performed. The plot shows the onset of a strong near coastal
current on 23 October (marked by the first dashed line from the left) and a drop in SST
due to upwelling and southward advection of cold water masses. We suspect that flow
separation at Cap-Vert, as visible in the simulated flow field depicted in Fig. 11.12b,
represents the initial stage of the highly nonlinear eddy generation process. However,
the model is not capable to reproduce the cyclogenesis in detail and cannot describe
the generation of highly nonlinear eddies. But the model is capable of describing
W. Alpers et al.
Fig. 11.12 Upper panels a, b, and c: simulated sea surface current field (black arrows) superimposed
on the simulated SST field (colors) calculated by the Mercatormodel for 00 UTC on (a) 23 October,
(b) 27 October, and (c) 31 October 2011, respectively. The maps show the surface current fields
before and after the onset of the enhanced surface flow caused by the wind burst. Panel c shows
that cold water has intruded the area southwest of Cap-Vert (marked by a thick black arrow) and
that south of Cap-Vertwarmwater is flowing northward along the coast. This cyclonic circulation
pattern suggests that flow separation has taken place. Lower panel: d time series of the sea surface
temperature (black curve) and the along-shore surface current (red curve) at the grid point 15.39
◦ N,
16.83
◦ W, which is the grid point next to the coast slightly north of Cap-Vert (marked by a white
plus sign in panels a, b, and c), simulated by the Mercator model. It shows the development of a
strong southwestward near coastal current starting on 23 October 2011. The three dashed vertical
lines mark the times at which the simulations shown in panels a, b. and c were performed
of Cap-Vert and that south of Cap-Vert warm water is flowing northward along the
coast. This flow forms, together with the southward flow further west, a cyclonic
flow pattern. Such a recirculation of water behind an obstacle is typical for eddy
generation by flow separation.
The onset of the along-shore flow on 23 October can also be seen on the plot
depicted in Fig. 11.12d, which shows how the simulated SST (black curve) and
along-shore surface current (red curve) varied with time. The plot applies for the
grid point 15.39
◦ N, 16.83
◦ W (marked by a white cross), which is the grid point
next to the coast, slightly north of Cap-Vert (see Fig. 11.12). The three dashed
vertical lines inserted in Fig. 11.12d mark the times at which the simulations shown
in Fig. 11.12a–c were performed. The plot shows the onset of a strong near coastal
current on 23 October (marked by the first dashed line from the left) and a drop in SST
due to upwelling and southward advection of cold water masses. We suspect that flow
separation at Cap-Vert, as visible in the simulated flow field depicted in Fig. 11.12b,
represents the initial stage of the highly nonlinear eddy generation process. However,
the model is not capable to reproduce the cyclogenesis in detail and cannot describe
the generation of highly nonlinear eddies. But the model is capable of describing