

11 Satellite Observations of Oceanic Eddies Around Africa
221
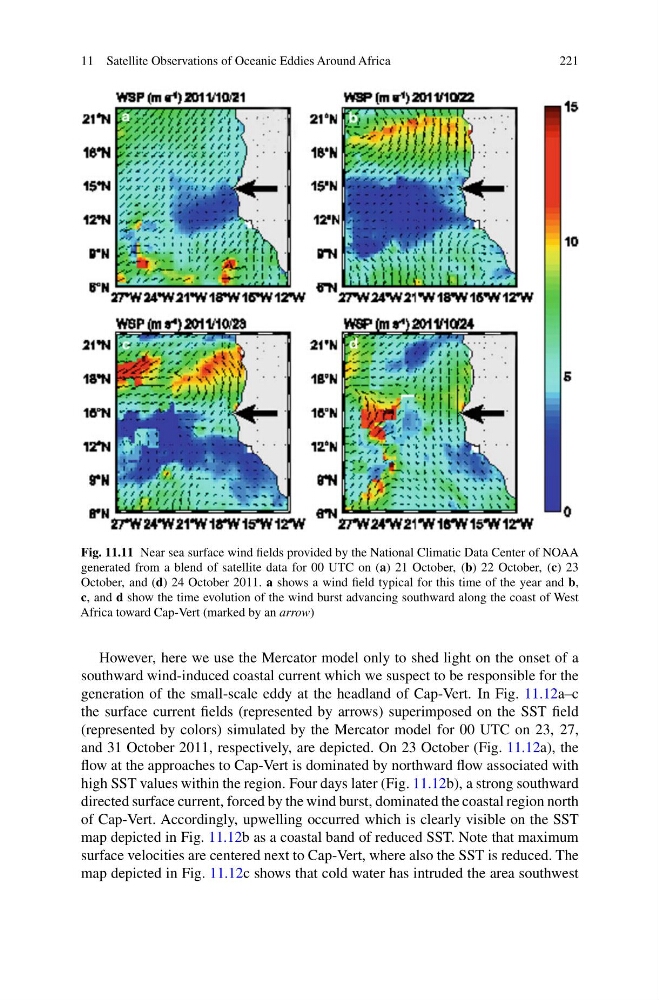
Fig. 11.11 Near sea surface wind fields provided by the National Climatic Data Center of NOAA
generated from a blend of satellite data for 00 UTC on (a) 21 October, (b) 22 October, (c) 23
October, and (d) 24 October 2011. a shows a wind field typical for this time of the year and b,
c, and d show the time evolution of the wind burst advancing southward along the coast of West
Africa toward Cap-Vert (marked by an arrow)
However, here we use the Mercator model only to shed light on the onset of a
southward wind-induced coastal current which we suspect to be responsible for the
generation of the small-scale eddy at the headland of Cap-Vert. In Fig. 11.12a–c
the surface current fields (represented by arrows) superimposed on the SST field
(represented by colors) simulated by the Mercator model for 00 UTC on 23, 27,
and 31 October 2011, respectively, are depicted. On 23 October (Fig. 11.12a), the
flow at the approaches to Cap-Vert is dominated by northward flow associated with
high SST values within the region. Four days later (Fig. 11.12b), a strong southward
directed surface current, forced by the wind burst, dominated the coastal region north
of Cap-Vert. Accordingly, upwelling occurred which is clearly visible on the SST
map depicted in Fig. 11.12b as a coastal band of reduced SST. Note that maximum
surface velocities are centered next to Cap-Vert, where also the SST is reduced. The
map depicted in Fig. 11.12c shows that cold water has intruded the area southwest
221
Fig. 11.11 Near sea surface wind fields provided by the National Climatic Data Center of NOAA
generated from a blend of satellite data for 00 UTC on (a) 21 October, (b) 22 October, (c) 23
October, and (d) 24 October 2011. a shows a wind field typical for this time of the year and b,
c, and d show the time evolution of the wind burst advancing southward along the coast of West
Africa toward Cap-Vert (marked by an arrow)
However, here we use the Mercator model only to shed light on the onset of a
southward wind-induced coastal current which we suspect to be responsible for the
generation of the small-scale eddy at the headland of Cap-Vert. In Fig. 11.12a–c
the surface current fields (represented by arrows) superimposed on the SST field
(represented by colors) simulated by the Mercator model for 00 UTC on 23, 27,
and 31 October 2011, respectively, are depicted. On 23 October (Fig. 11.12a), the
flow at the approaches to Cap-Vert is dominated by northward flow associated with
high SST values within the region. Four days later (Fig. 11.12b), a strong southward
directed surface current, forced by the wind burst, dominated the coastal region north
of Cap-Vert. Accordingly, upwelling occurred which is clearly visible on the SST
map depicted in Fig. 11.12b as a coastal band of reduced SST. Note that maximum
surface velocities are centered next to Cap-Vert, where also the SST is reduced. The
map depicted in Fig. 11.12c shows that cold water has intruded the area southwest