

220
W. Alpers et al.
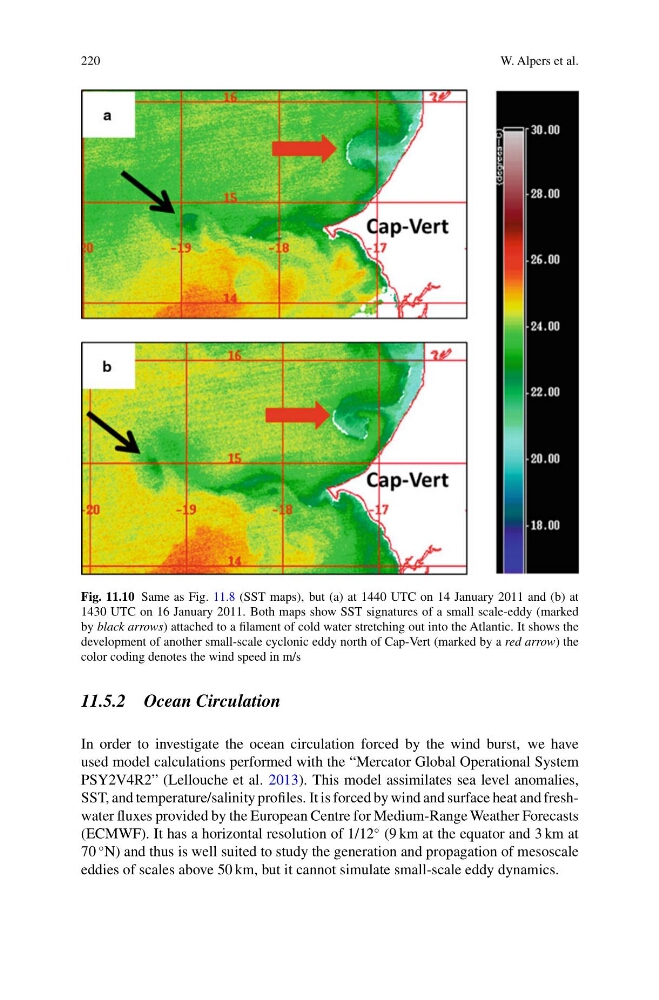
Fig. 11.10 Same as Fig. 11.8 (SST maps), but (a) at 1440 UTC on 14 January 2011 and (b) at
1430 UTC on 16 January 2011. Both maps show SST signatures of a small scale-eddy (marked
by black arrows) attached to a filament of cold water stretching out into the Atlantic. It shows the
development of another small-scale cyclonic eddy north of Cap-Vert (marked by a red arrow) the
color coding denotes the wind speed in m/s
11.5.2 Ocean Circulation
In order to investigate the ocean circulation forced by the wind burst, we have
used model calculations performed with the “Mercator Global Operational System
PSY2V4R2” (Lellouche et al. 2013). This model assimilates sea level anomalies,
SST, and temperature/salinity profiles. It is forced by wind and surface heat and freshwater fluxes provided by the European Centre for Medium-Range Weather Forecasts
(ECMWF). It has a horizontal resolution of 1/12
◦ (9 km at the equator and 3 km at
70
◦ N) and thus is well suited to study the generation and propagation of mesoscale
eddies of scales above 50 km, but it cannot simulate small-scale eddy dynamics.
W. Alpers et al.
Fig. 11.10 Same as Fig. 11.8 (SST maps), but (a) at 1440 UTC on 14 January 2011 and (b) at
1430 UTC on 16 January 2011. Both maps show SST signatures of a small scale-eddy (marked
by black arrows) attached to a filament of cold water stretching out into the Atlantic. It shows the
development of another small-scale cyclonic eddy north of Cap-Vert (marked by a red arrow) the
color coding denotes the wind speed in m/s
11.5.2 Ocean Circulation
In order to investigate the ocean circulation forced by the wind burst, we have
used model calculations performed with the “Mercator Global Operational System
PSY2V4R2” (Lellouche et al. 2013). This model assimilates sea level anomalies,
SST, and temperature/salinity profiles. It is forced by wind and surface heat and freshwater fluxes provided by the European Centre for Medium-Range Weather Forecasts
(ECMWF). It has a horizontal resolution of 1/12
◦ (9 km at the equator and 3 km at
70
◦ N) and thus is well suited to study the generation and propagation of mesoscale
eddies of scales above 50 km, but it cannot simulate small-scale eddy dynamics.