

11 Satellite Observations of Oceanic Eddies Around Africa
219
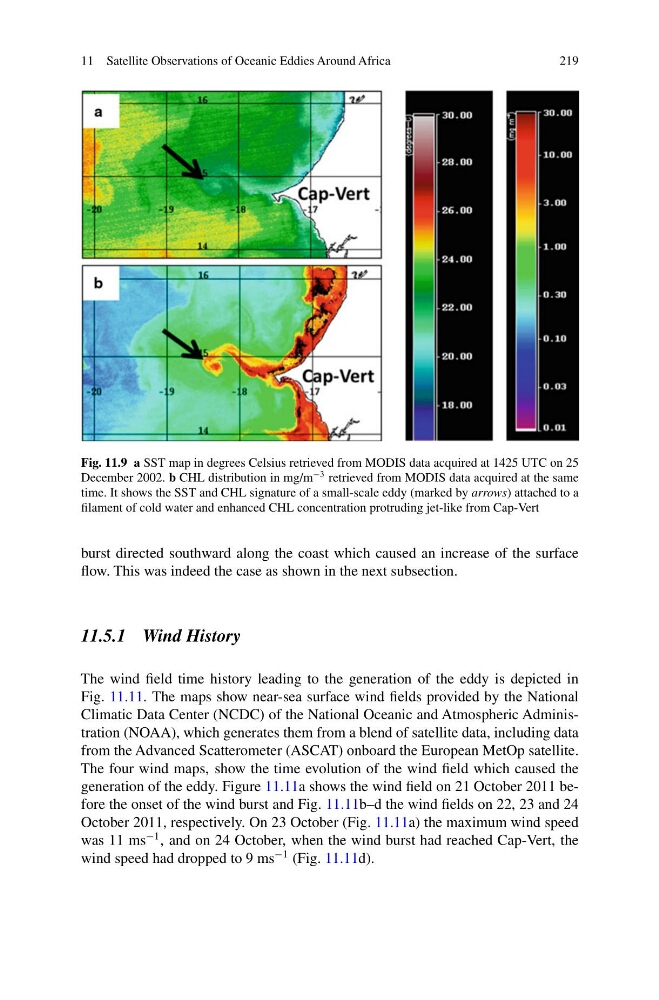
Fig. 11.9 a SST map in degrees Celsius retrieved from MODIS data acquired at 1425 UTC on 25
December 2002. b CHL distribution in mg/m
−3 retrieved from MODIS data acquired at the same
time. It shows the SST and CHL signature of a small-scale eddy (marked by arrows) attached to a
filament of cold water and enhanced CHL concentration protruding jet-like from Cap-Vert
burst directed southward along the coast which caused an increase of the surface
flow. This was indeed the case as shown in the next subsection.
11.5.1 Wind History
The wind field time history leading to the generation of the eddy is depicted in
Fig. 11.11. The maps show near-sea surface wind fields provided by the National
Climatic Data Center (NCDC) of the National Oceanic and Atmospheric Administration (NOAA), which generates them from a blend of satellite data, including data
from the Advanced Scatterometer (ASCAT) onboard the European MetOp satellite.
The four wind maps, show the time evolution of the wind field which caused the
generation of the eddy. Figure 11.11a shows the wind field on 21 October 2011 before the onset of the wind burst and Fig. 11.11b–d the wind fields on 22, 23 and 24
October 2011, respectively. On 23 October (Fig. 11.11a) the maximum wind speed
was 11 ms
−1 , and on 24 October, when the wind burst had reached Cap-Vert, the
wind speed had dropped to 9 ms
−1 (Fig. 11.11d).
219
Fig. 11.9 a SST map in degrees Celsius retrieved from MODIS data acquired at 1425 UTC on 25
December 2002. b CHL distribution in mg/m
−3 retrieved from MODIS data acquired at the same
time. It shows the SST and CHL signature of a small-scale eddy (marked by arrows) attached to a
filament of cold water and enhanced CHL concentration protruding jet-like from Cap-Vert
burst directed southward along the coast which caused an increase of the surface
flow. This was indeed the case as shown in the next subsection.
11.5.1 Wind History
The wind field time history leading to the generation of the eddy is depicted in
Fig. 11.11. The maps show near-sea surface wind fields provided by the National
Climatic Data Center (NCDC) of the National Oceanic and Atmospheric Administration (NOAA), which generates them from a blend of satellite data, including data
from the Advanced Scatterometer (ASCAT) onboard the European MetOp satellite.
The four wind maps, show the time evolution of the wind field which caused the
generation of the eddy. Figure 11.11a shows the wind field on 21 October 2011 before the onset of the wind burst and Fig. 11.11b–d the wind fields on 22, 23 and 24
October 2011, respectively. On 23 October (Fig. 11.11a) the maximum wind speed
was 11 ms
−1 , and on 24 October, when the wind burst had reached Cap-Vert, the
wind speed had dropped to 9 ms
−1 (Fig. 11.11d).