

8 Oil Pollution in Coastal Waters of Nigeria
157
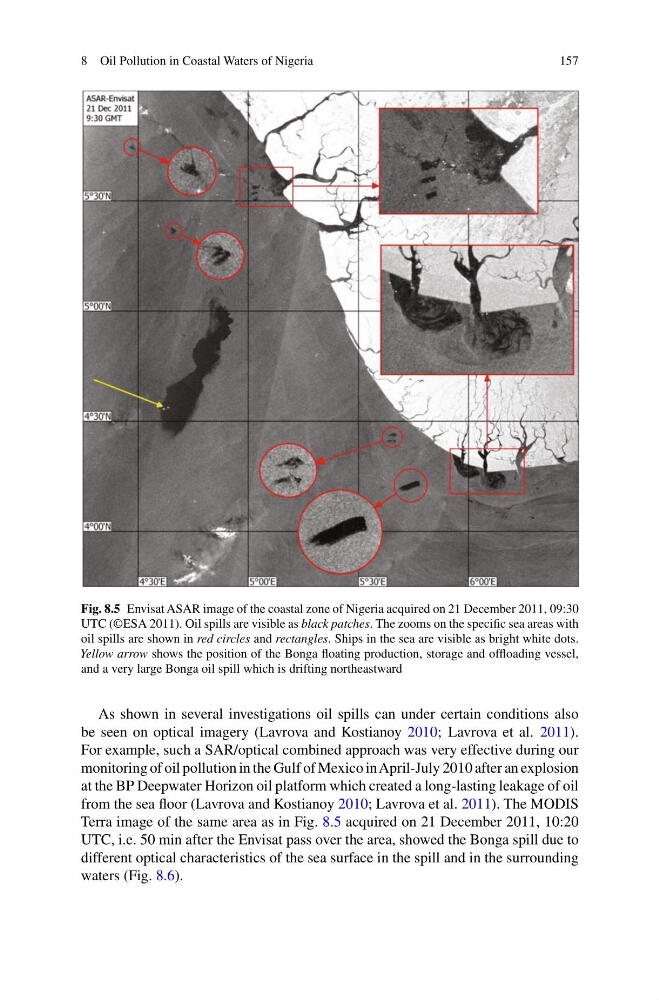
Fig. 8.5 Envisat ASAR image of the coastal zone of Nigeria acquired on 21 December 2011, 09:30
UTC (©ESA 2011). Oil spills are visible as black patches. The zooms on the specific sea areas with
oil spills are shown in red circles and rectangles. Ships in the sea are visible as bright white dots.
Yellow arrow shows the position of the Bonga floating production, storage and offloading vessel,
and a very large Bonga oil spill which is drifting northeastward
As shown in several investigations oil spills can under certain conditions also
be seen on optical imagery (Lavrova and Kostianoy 2010; Lavrova et al. 2011).
For example, such a SAR/optical combined approach was very effective during our
monitoring of oil pollution in the Gulf of Mexico inApril-July 2010 after an explosion
at the BP Deepwater Horizon oil platform which created a long-lasting leakage of oil
from the sea floor (Lavrova and Kostianoy 2010; Lavrova et al. 2011). The MODIS
Terra image of the same area as in Fig. 8.5 acquired on 21 December 2011, 10:20
UTC, i.e. 50 min after the Envisat pass over the area, showed the Bonga spill due to
different optical characteristics of the sea surface in the spill and in the surrounding
waters (Fig. 8.6).
157
Fig. 8.5 Envisat ASAR image of the coastal zone of Nigeria acquired on 21 December 2011, 09:30
UTC (©ESA 2011). Oil spills are visible as black patches. The zooms on the specific sea areas with
oil spills are shown in red circles and rectangles. Ships in the sea are visible as bright white dots.
Yellow arrow shows the position of the Bonga floating production, storage and offloading vessel,
and a very large Bonga oil spill which is drifting northeastward
As shown in several investigations oil spills can under certain conditions also
be seen on optical imagery (Lavrova and Kostianoy 2010; Lavrova et al. 2011).
For example, such a SAR/optical combined approach was very effective during our
monitoring of oil pollution in the Gulf of Mexico inApril-July 2010 after an explosion
at the BP Deepwater Horizon oil platform which created a long-lasting leakage of oil
from the sea floor (Lavrova and Kostianoy 2010; Lavrova et al. 2011). The MODIS
Terra image of the same area as in Fig. 8.5 acquired on 21 December 2011, 10:20
UTC, i.e. 50 min after the Envisat pass over the area, showed the Bonga spill due to
different optical characteristics of the sea surface in the spill and in the surrounding
waters (Fig. 8.6).