

6 Impacts of Saharan Dust on the Marine Environment in the Area . . .
131
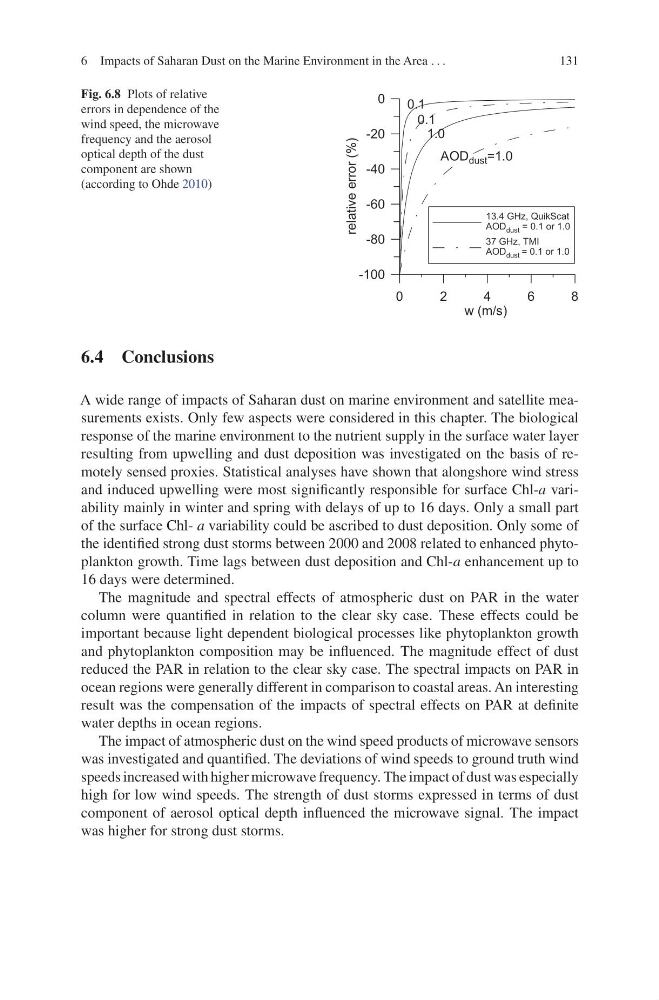
Fig. 6.8 Plots of relative
errors in dependence of the
wind speed, the microwave
frequency and the aerosol
optical depth of the dust
component are shown
(according to Ohde 2010)
0
2
4
6
8
w (m/s)
-100
-80
-60
-40
-20
0
relative error (%)
13.4 GHz, QuikScat
AOD dust = 0.1 or 1.0
37 GHz, TMI
AOD dust = 0.1 or 1.0
0.1
1.0
0.1
AOD dust =1.0
6.4 Conclusions
A wide range of impacts of Saharan dust on marine environment and satellite measurements exists. Only few aspects were considered in this chapter. The biological
response of the marine environment to the nutrient supply in the surface water layer
resulting from upwelling and dust deposition was investigated on the basis of remotely sensed proxies. Statistical analyses have shown that alongshore wind stress
and induced upwelling were most significantly responsible for surface Chl-a variability mainly in winter and spring with delays of up to 16 days. Only a small part
of the surface Chl- a variability could be ascribed to dust deposition. Only some of
the identified strong dust storms between 2000 and 2008 related to enhanced phytoplankton growth. Time lags between dust deposition and Chl-a enhancement up to
16 days were determined.
The magnitude and spectral effects of atmospheric dust on PAR in the water
column were quantified in relation to the clear sky case. These effects could be
important because light dependent biological processes like phytoplankton growth
and phytoplankton composition may be influenced. The magnitude effect of dust
reduced the PAR in relation to the clear sky case. The spectral impacts on PAR in
ocean regions were generally different in comparison to coastal areas. An interesting
result was the compensation of the impacts of spectral effects on PAR at definite
water depths in ocean regions.
The impact of atmospheric dust on the wind speed products of microwave sensors
was investigated and quantified. The deviations of wind speeds to ground truth wind
speeds increased with higher microwave frequency. The impact of dust was especially
high for low wind speeds. The strength of dust storms expressed in terms of dust
component of aerosol optical depth influenced the microwave signal. The impact
was higher for strong dust storms.
131
Fig. 6.8 Plots of relative
errors in dependence of the
wind speed, the microwave
frequency and the aerosol
optical depth of the dust
component are shown
(according to Ohde 2010)
0
2
4
6
8
w (m/s)
-100
-80
-60
-40
-20
0
relative error (%)
13.4 GHz, QuikScat
AOD dust = 0.1 or 1.0
37 GHz, TMI
AOD dust = 0.1 or 1.0
0.1
1.0
0.1
AOD dust =1.0
6.4 Conclusions
A wide range of impacts of Saharan dust on marine environment and satellite measurements exists. Only few aspects were considered in this chapter. The biological
response of the marine environment to the nutrient supply in the surface water layer
resulting from upwelling and dust deposition was investigated on the basis of remotely sensed proxies. Statistical analyses have shown that alongshore wind stress
and induced upwelling were most significantly responsible for surface Chl-a variability mainly in winter and spring with delays of up to 16 days. Only a small part
of the surface Chl- a variability could be ascribed to dust deposition. Only some of
the identified strong dust storms between 2000 and 2008 related to enhanced phytoplankton growth. Time lags between dust deposition and Chl-a enhancement up to
16 days were determined.
The magnitude and spectral effects of atmospheric dust on PAR in the water
column were quantified in relation to the clear sky case. These effects could be
important because light dependent biological processes like phytoplankton growth
and phytoplankton composition may be influenced. The magnitude effect of dust
reduced the PAR in relation to the clear sky case. The spectral impacts on PAR in
ocean regions were generally different in comparison to coastal areas. An interesting
result was the compensation of the impacts of spectral effects on PAR at definite
water depths in ocean regions.
The impact of atmospheric dust on the wind speed products of microwave sensors
was investigated and quantified. The deviations of wind speeds to ground truth wind
speeds increased with higher microwave frequency. The impact of dust was especially
high for low wind speeds. The strength of dust storms expressed in terms of dust
component of aerosol optical depth influenced the microwave signal. The impact
was higher for strong dust storms.