

130
T. Ohde and H. Siegel
W METAR
W QuikScat
5/1/2007 5/4/2007 5/7/2007 5/10/2007 5/13/2007 5/16/2007 5/19/2007
date
0
4
8
12
w
METAR ,
w
QuikSCAT (m/s)
0.0
0.4
0.8
1.2
1.6
AOD
dust
AOD dust
,
a
b
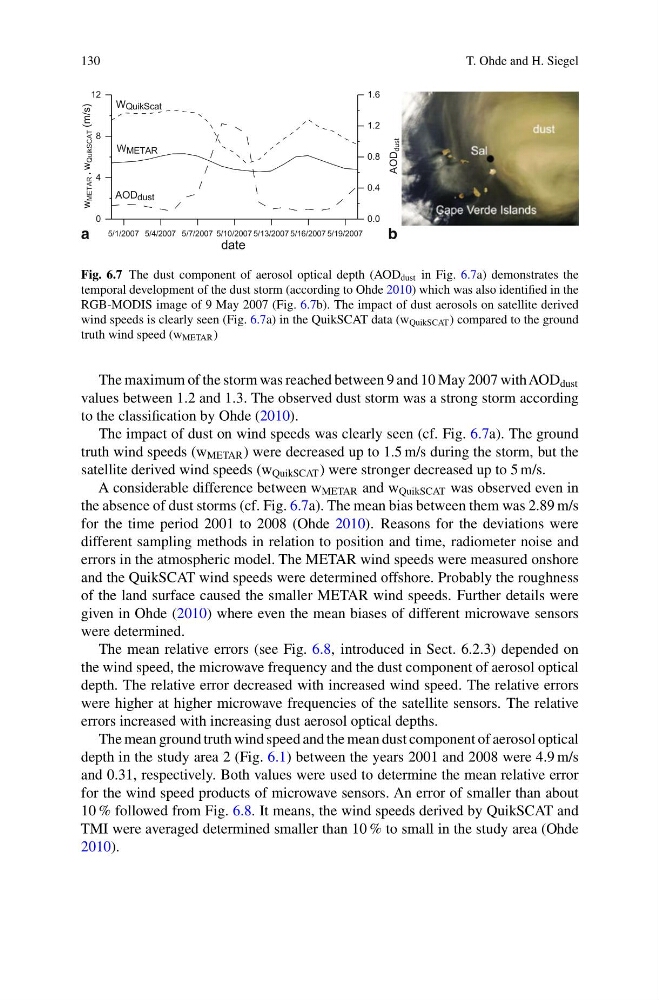
Fig. 6.7 The dust component of aerosol optical depth (AOD dust in Fig. 6.7a) demonstrates the
temporal development of the dust storm (according to Ohde 2010) which was also identified in the
RGB-MODIS image of 9 May 2007 (Fig. 6.7b). The impact of dust aerosols on satellite derived
wind speeds is clearly seen (Fig. 6.7a) in the QuikSCAT data (w QuikSCAT ) compared to the ground
truth wind speed (w METAR )
The maximum of the storm was reached between 9 and 10 May 2007 with AOD dust
values between 1.2 and 1.3. The observed dust storm was a strong storm according
to the classification by Ohde (2010).
The impact of dust on wind speeds was clearly seen (cf. Fig. 6.7a). The ground
truth wind speeds (w METAR ) were decreased up to 1.5 m/s during the storm, but the
satellite derived wind speeds (w QuikSCAT ) were stronger decreased up to 5 m/s.
A considerable difference between w METAR and w QuikSCAT was observed even in
the absence of dust storms (cf. Fig. 6.7a). The mean bias between them was 2.89 m/s
for the time period 2001 to 2008 (Ohde 2010). Reasons for the deviations were
different sampling methods in relation to position and time, radiometer noise and
errors in the atmospheric model. The METAR wind speeds were measured onshore
and the QuikSCAT wind speeds were determined offshore. Probably the roughness
of the land surface caused the smaller METAR wind speeds. Further details were
given in Ohde (2010) where even the mean biases of different microwave sensors
were determined.
The mean relative errors (see Fig. 6.8, introduced in Sect. 6.2.3) depended on
the wind speed, the microwave frequency and the dust component of aerosol optical
depth. The relative error decreased with increased wind speed. The relative errors
were higher at higher microwave frequencies of the satellite sensors. The relative
errors increased with increasing dust aerosol optical depths.
The mean ground truth wind speed and the mean dust component of aerosol optical
depth in the study area 2 (Fig. 6.1) between the years 2001 and 2008 were 4.9 m/s
and 0.31, respectively. Both values were used to determine the mean relative error
for the wind speed products of microwave sensors. An error of smaller than about
10 % followed from Fig. 6.8. It means, the wind speeds derived by QuikSCAT and
TMI were averaged determined smaller than 10 % to small in the study area (Ohde
2010).
T. Ohde and H. Siegel
W METAR
W QuikScat
5/1/2007 5/4/2007 5/7/2007 5/10/2007 5/13/2007 5/16/2007 5/19/2007
date
0
4
8
12
w
METAR ,
w
QuikSCAT (m/s)
0.0
0.4
0.8
1.2
1.6
AOD
dust
AOD dust
,
a
b
Fig. 6.7 The dust component of aerosol optical depth (AOD dust in Fig. 6.7a) demonstrates the
temporal development of the dust storm (according to Ohde 2010) which was also identified in the
RGB-MODIS image of 9 May 2007 (Fig. 6.7b). The impact of dust aerosols on satellite derived
wind speeds is clearly seen (Fig. 6.7a) in the QuikSCAT data (w QuikSCAT ) compared to the ground
truth wind speed (w METAR )
The maximum of the storm was reached between 9 and 10 May 2007 with AOD dust
values between 1.2 and 1.3. The observed dust storm was a strong storm according
to the classification by Ohde (2010).
The impact of dust on wind speeds was clearly seen (cf. Fig. 6.7a). The ground
truth wind speeds (w METAR ) were decreased up to 1.5 m/s during the storm, but the
satellite derived wind speeds (w QuikSCAT ) were stronger decreased up to 5 m/s.
A considerable difference between w METAR and w QuikSCAT was observed even in
the absence of dust storms (cf. Fig. 6.7a). The mean bias between them was 2.89 m/s
for the time period 2001 to 2008 (Ohde 2010). Reasons for the deviations were
different sampling methods in relation to position and time, radiometer noise and
errors in the atmospheric model. The METAR wind speeds were measured onshore
and the QuikSCAT wind speeds were determined offshore. Probably the roughness
of the land surface caused the smaller METAR wind speeds. Further details were
given in Ohde (2010) where even the mean biases of different microwave sensors
were determined.
The mean relative errors (see Fig. 6.8, introduced in Sect. 6.2.3) depended on
the wind speed, the microwave frequency and the dust component of aerosol optical
depth. The relative error decreased with increased wind speed. The relative errors
were higher at higher microwave frequencies of the satellite sensors. The relative
errors increased with increasing dust aerosol optical depths.
The mean ground truth wind speed and the mean dust component of aerosol optical
depth in the study area 2 (Fig. 6.1) between the years 2001 and 2008 were 4.9 m/s
and 0.31, respectively. Both values were used to determine the mean relative error
for the wind speed products of microwave sensors. An error of smaller than about
10 % followed from Fig. 6.8. It means, the wind speeds derived by QuikSCAT and
TMI were averaged determined smaller than 10 % to small in the study area (Ohde
2010).