

6 Impacts of Saharan Dust on the Marine Environment in the Area . . .
129
N (dimensionless)
-30.0
-20.0
-10.0
0.0
10.0
∆
m Q
PAR /Q
PAR (%)
a
0.7
0.7
0.7
N (dimensionless)
-4
-2
0
2
4
∆
s Q
PAR /Q
PAR ( %)
z=20m
N (dimensionless)
-4
-2
0
2
4
∆
s Q
PAR /Q
PAR
(%)
z=0 m
-
z=0 m
-
z=20m
ocean region
coastal region
b
c
0.8
0.8
0.8
0.9
0.9
0.9
1.0
1.0
1.0
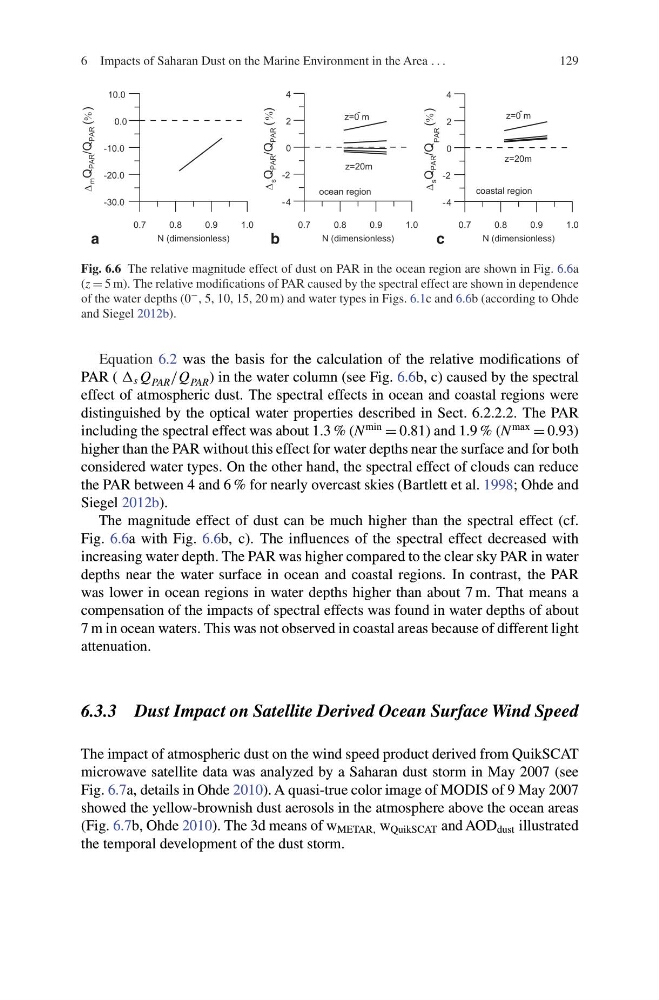
Fig. 6.6 The relative magnitude effect of dust on PAR in the ocean region are shown in Fig. 6.6a
(z = 5 m). The relative modifications of PAR caused by the spectral effect are shown in dependence
of the water depths (0
− , 5, 10, 15, 20 m) and water types in Figs. 6.1c and 6.6b (according to Ohde
and Siegel 2012b).
Equation 6.2 was the basis for the calculation of the relative modifications of
PAR ( Δ s Q PAR /Q PAR ) in the water column (see Fig. 6.6b, c) caused by the spectral
effect of atmospheric dust. The spectral effects in ocean and coastal regions were
distinguished by the optical water properties described in Sect. 6.2.2.2. The PAR
including the spectral effect was about 1.3 % (N
min
= 0.81) and 1.9 % (N
max
= 0.93)
higher than the PAR without this effect for water depths near the surface and for both
considered water types. On the other hand, the spectral effect of clouds can reduce
the PAR between 4 and 6 % for nearly overcast skies (Bartlett et al. 1998; Ohde and
Siegel 2012b).
The magnitude effect of dust can be much higher than the spectral effect (cf.
Fig. 6.6a with Fig. 6.6b, c). The influences of the spectral effect decreased with
increasing water depth. The PAR was higher compared to the clear sky PAR in water
depths near the water surface in ocean and coastal regions. In contrast, the PAR
was lower in ocean regions in water depths higher than about 7 m. That means a
compensation of the impacts of spectral effects was found in water depths of about
7 m in ocean waters. This was not observed in coastal areas because of different light
attenuation.
6.3.3 Dust Impact on Satellite Derived Ocean Surface Wind Speed
The impact of atmospheric dust on the wind speed product derived from QuikSCAT
microwave satellite data was analyzed by a Saharan dust storm in May 2007 (see
Fig. 6.7a, details in Ohde 2010). A quasi-true color image of MODIS of 9 May 2007
showed the yellow-brownish dust aerosols in the atmosphere above the ocean areas
(Fig. 6.7b, Ohde 2010). The 3d means of w METAR, w QuikSCAT and AOD dust illustrated
the temporal development of the dust storm.
129
N (dimensionless)
-30.0
-20.0
-10.0
0.0
10.0
∆
m Q
PAR /Q
PAR (%)
a
0.7
0.7
0.7
N (dimensionless)
-4
-2
0
2
4
∆
s Q
PAR /Q
PAR ( %)
z=20m
N (dimensionless)
-4
-2
0
2
4
∆
s Q
PAR /Q
PAR
(%)
z=0 m
-
z=0 m
-
z=20m
ocean region
coastal region
b
c
0.8
0.8
0.8
0.9
0.9
0.9
1.0
1.0
1.0
Fig. 6.6 The relative magnitude effect of dust on PAR in the ocean region are shown in Fig. 6.6a
(z = 5 m). The relative modifications of PAR caused by the spectral effect are shown in dependence
of the water depths (0
− , 5, 10, 15, 20 m) and water types in Figs. 6.1c and 6.6b (according to Ohde
and Siegel 2012b).
Equation 6.2 was the basis for the calculation of the relative modifications of
PAR ( Δ s Q PAR /Q PAR ) in the water column (see Fig. 6.6b, c) caused by the spectral
effect of atmospheric dust. The spectral effects in ocean and coastal regions were
distinguished by the optical water properties described in Sect. 6.2.2.2. The PAR
including the spectral effect was about 1.3 % (N
min
= 0.81) and 1.9 % (N
max
= 0.93)
higher than the PAR without this effect for water depths near the surface and for both
considered water types. On the other hand, the spectral effect of clouds can reduce
the PAR between 4 and 6 % for nearly overcast skies (Bartlett et al. 1998; Ohde and
Siegel 2012b).
The magnitude effect of dust can be much higher than the spectral effect (cf.
Fig. 6.6a with Fig. 6.6b, c). The influences of the spectral effect decreased with
increasing water depth. The PAR was higher compared to the clear sky PAR in water
depths near the water surface in ocean and coastal regions. In contrast, the PAR
was lower in ocean regions in water depths higher than about 7 m. That means a
compensation of the impacts of spectral effects was found in water depths of about
7 m in ocean waters. This was not observed in coastal areas because of different light
attenuation.
6.3.3 Dust Impact on Satellite Derived Ocean Surface Wind Speed
The impact of atmospheric dust on the wind speed product derived from QuikSCAT
microwave satellite data was analyzed by a Saharan dust storm in May 2007 (see
Fig. 6.7a, details in Ohde 2010). A quasi-true color image of MODIS of 9 May 2007
showed the yellow-brownish dust aerosols in the atmosphere above the ocean areas
(Fig. 6.7b, Ohde 2010). The 3d means of w METAR, w QuikSCAT and AOD dust illustrated
the temporal development of the dust storm.