

128
T. Ohde and H. Siegel
dust
5 December 2008
15 December 2008
Cape Verde
Islands
b
a
25 December 2008
d
19 December 2008
algaebloom
c
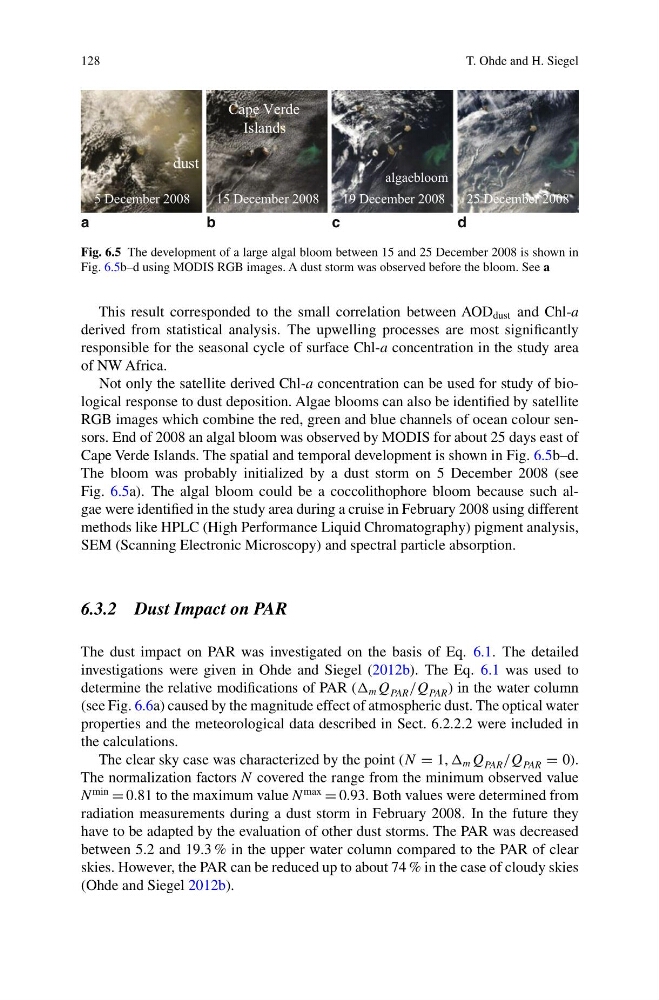
Fig. 6.5 The development of a large algal bloom between 15 and 25 December 2008 is shown in
Fig. 6.5b–d using MODIS RGB images. A dust storm was observed before the bloom. See a
This result corresponded to the small correlation between AOD dust and Chl-a
derived from statistical analysis. The upwelling processes are most significantly
responsible for the seasonal cycle of surface Chl-a concentration in the study area
of NW Africa.
Not only the satellite derived Chl-a concentration can be used for study of biological response to dust deposition. Algae blooms can also be identified by satellite
RGB images which combine the red, green and blue channels of ocean colour sensors. End of 2008 an algal bloom was observed by MODIS for about 25 days east of
Cape Verde Islands. The spatial and temporal development is shown in Fig. 6.5b–d.
The bloom was probably initialized by a dust storm on 5 December 2008 (see
Fig. 6.5a). The algal bloom could be a coccolithophore bloom because such algae were identified in the study area during a cruise in February 2008 using different
methods like HPLC (High Performance Liquid Chromatography) pigment analysis,
SEM (Scanning Electronic Microscopy) and spectral particle absorption.
6.3.2 Dust Impact on PAR
The dust impact on PAR was investigated on the basis of Eq. 6.1. The detailed
investigations were given in Ohde and Siegel (2012b). The Eq. 6.1 was used to
determine the relative modifications of PAR (Δ m Q PAR /Q PAR ) in the water column
(see Fig. 6.6a) caused by the magnitude effect of atmospheric dust. The optical water
properties and the meteorological data described in Sect. 6.2.2.2 were included in
the calculations.
The clear sky case was characterized by the point (N = 1, Δ m Q PAR /Q PAR = 0).
The normalization factors N covered the range from the minimum observed value
N
min
= 0.81 to the maximum value N
max
= 0.93. Both values were determined from
radiation measurements during a dust storm in February 2008. In the future they
have to be adapted by the evaluation of other dust storms. The PAR was decreased
between 5.2 and 19.3 % in the upper water column compared to the PAR of clear
skies. However, the PAR can be reduced up to about 74 % in the case of cloudy skies
(Ohde and Siegel 2012b).
T. Ohde and H. Siegel
dust
5 December 2008
15 December 2008
Cape Verde
Islands
b
a
25 December 2008
d
19 December 2008
algaebloom
c
Fig. 6.5 The development of a large algal bloom between 15 and 25 December 2008 is shown in
Fig. 6.5b–d using MODIS RGB images. A dust storm was observed before the bloom. See a
This result corresponded to the small correlation between AOD dust and Chl-a
derived from statistical analysis. The upwelling processes are most significantly
responsible for the seasonal cycle of surface Chl-a concentration in the study area
of NW Africa.
Not only the satellite derived Chl-a concentration can be used for study of biological response to dust deposition. Algae blooms can also be identified by satellite
RGB images which combine the red, green and blue channels of ocean colour sensors. End of 2008 an algal bloom was observed by MODIS for about 25 days east of
Cape Verde Islands. The spatial and temporal development is shown in Fig. 6.5b–d.
The bloom was probably initialized by a dust storm on 5 December 2008 (see
Fig. 6.5a). The algal bloom could be a coccolithophore bloom because such algae were identified in the study area during a cruise in February 2008 using different
methods like HPLC (High Performance Liquid Chromatography) pigment analysis,
SEM (Scanning Electronic Microscopy) and spectral particle absorption.
6.3.2 Dust Impact on PAR
The dust impact on PAR was investigated on the basis of Eq. 6.1. The detailed
investigations were given in Ohde and Siegel (2012b). The Eq. 6.1 was used to
determine the relative modifications of PAR (Δ m Q PAR /Q PAR ) in the water column
(see Fig. 6.6a) caused by the magnitude effect of atmospheric dust. The optical water
properties and the meteorological data described in Sect. 6.2.2.2 were included in
the calculations.
The clear sky case was characterized by the point (N = 1, Δ m Q PAR /Q PAR = 0).
The normalization factors N covered the range from the minimum observed value
N
min
= 0.81 to the maximum value N
max
= 0.93. Both values were determined from
radiation measurements during a dust storm in February 2008. In the future they
have to be adapted by the evaluation of other dust storms. The PAR was decreased
between 5.2 and 19.3 % in the upper water column compared to the PAR of clear
skies. However, the PAR can be reduced up to about 74 % in the case of cloudy skies
(Ohde and Siegel 2012b).