

6 Impacts of Saharan Dust on the Marine Environment in the Area . . .
127
0.00
1.00
2.00
0.00
0.04
0.08
0.12
0.00
0.40
0.80
Chl-a (mg/m 3
)
(N/m 2
)
AOD
dust
high
low
0.00
0.50
1.00
1.50
0.00
0.04
0.08
0.12
0.00
0.40
0.80
Chl-a (mg/m 3
)
(N/m 2
)
AOD
dust
high
low
9 May 2007
Dakar
9 March 2006
Dakar
a
b
02/11/06 03/12/06 04/11/06
04/23/07 05/13/07 06/02/07
3
)
2
)
3
)
2
)
9 May 2007
Dakar
9 March 2006
Dakar
v
Ј
v
Ј
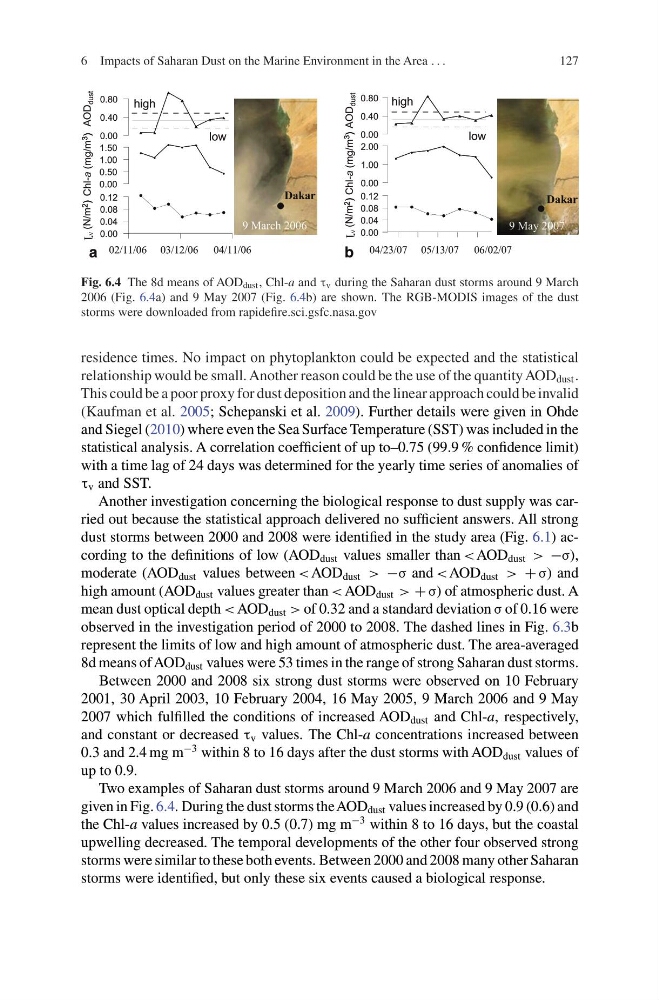
Fig. 6.4 The 8d means of AOD dust , Chl-a and τ v during the Saharan dust storms around 9 March
2006 (Fig. 6.4a) and 9 May 2007 (Fig. 6.4b) are shown. The RGB-MODIS images of the dust
storms were downloaded from rapidefire.sci.gsfc.nasa.gov
residence times. No impact on phytoplankton could be expected and the statistical
relationship would be small. Another reason could be the use of the quantity AOD dust .
This could be a poor proxy for dust deposition and the linear approach could be invalid
(Kaufman et al. 2005; Schepanski et al. 2009). Further details were given in Ohde
and Siegel (2010) where even the Sea Surface Temperature (SST) was included in the
statistical analysis. A correlation coefficient of up to–0.75 (99.9 % confidence limit)
with a time lag of 24 days was determined for the yearly time series of anomalies of
τ v and SST.
Another investigation concerning the biological response to dust supply was carried out because the statistical approach delivered no sufficient answers. All strong
dust storms between 2000 and 2008 were identified in the study area (Fig. 6.1) according to the definitions of low (AOD dust values smaller than < AOD dust > −σ),
moderate (AOD dust values between < AOD dust > −σ and < AOD dust > + σ) and
high amount (AOD dust values greater than < AOD dust > + σ) of atmospheric dust. A
mean dust optical depth < AOD dust > of 0.32 and a standard deviation σ of 0.16 were
observed in the investigation period of 2000 to 2008. The dashed lines in Fig. 6.3b
represent the limits of low and high amount of atmospheric dust. The area-averaged
8d means of AOD dust values were 53 times in the range of strong Saharan dust storms.
Between 2000 and 2008 six strong dust storms were observed on 10 February
2001, 30 April 2003, 10 February 2004, 16 May 2005, 9 March 2006 and 9 May
2007 which fulfilled the conditions of increased AOD dust and Chl-a, respectively,
and constant or decreased τ v values. The Chl-a concentrations increased between
0.3 and 2.4 mg m
−3 within 8 to 16 days after the dust storms with AOD dust values of
up to 0.9.
Two examples of Saharan dust storms around 9 March 2006 and 9 May 2007 are
given in Fig. 6.4. During the dust storms the AOD dust values increased by 0.9 (0.6) and
the Chl-a values increased by 0.5 (0.7) mg m
−3 within 8 to 16 days, but the coastal
upwelling decreased. The temporal developments of the other four observed strong
storms were similar to these both events. Between 2000 and 2008 many other Saharan
storms were identified, but only these six events caused a biological response.
127
0.00
1.00
2.00
0.00
0.04
0.08
0.12
0.00
0.40
0.80
Chl-a (mg/m 3
)
(N/m 2
)
AOD
dust
high
low
0.00
0.50
1.00
1.50
0.00
0.04
0.08
0.12
0.00
0.40
0.80
Chl-a (mg/m 3
)
(N/m 2
)
AOD
dust
high
low
9 May 2007
Dakar
9 March 2006
Dakar
a
b
02/11/06 03/12/06 04/11/06
04/23/07 05/13/07 06/02/07
3
)
2
)
3
)
2
)
9 May 2007
Dakar
9 March 2006
Dakar
v
Ј
v
Ј
Fig. 6.4 The 8d means of AOD dust , Chl-a and τ v during the Saharan dust storms around 9 March
2006 (Fig. 6.4a) and 9 May 2007 (Fig. 6.4b) are shown. The RGB-MODIS images of the dust
storms were downloaded from rapidefire.sci.gsfc.nasa.gov
residence times. No impact on phytoplankton could be expected and the statistical
relationship would be small. Another reason could be the use of the quantity AOD dust .
This could be a poor proxy for dust deposition and the linear approach could be invalid
(Kaufman et al. 2005; Schepanski et al. 2009). Further details were given in Ohde
and Siegel (2010) where even the Sea Surface Temperature (SST) was included in the
statistical analysis. A correlation coefficient of up to–0.75 (99.9 % confidence limit)
with a time lag of 24 days was determined for the yearly time series of anomalies of
τ v and SST.
Another investigation concerning the biological response to dust supply was carried out because the statistical approach delivered no sufficient answers. All strong
dust storms between 2000 and 2008 were identified in the study area (Fig. 6.1) according to the definitions of low (AOD dust values smaller than < AOD dust > −σ),
moderate (AOD dust values between < AOD dust > −σ and < AOD dust > + σ) and
high amount (AOD dust values greater than < AOD dust > + σ) of atmospheric dust. A
mean dust optical depth < AOD dust > of 0.32 and a standard deviation σ of 0.16 were
observed in the investigation period of 2000 to 2008. The dashed lines in Fig. 6.3b
represent the limits of low and high amount of atmospheric dust. The area-averaged
8d means of AOD dust values were 53 times in the range of strong Saharan dust storms.
Between 2000 and 2008 six strong dust storms were observed on 10 February
2001, 30 April 2003, 10 February 2004, 16 May 2005, 9 March 2006 and 9 May
2007 which fulfilled the conditions of increased AOD dust and Chl-a, respectively,
and constant or decreased τ v values. The Chl-a concentrations increased between
0.3 and 2.4 mg m
−3 within 8 to 16 days after the dust storms with AOD dust values of
up to 0.9.
Two examples of Saharan dust storms around 9 March 2006 and 9 May 2007 are
given in Fig. 6.4. During the dust storms the AOD dust values increased by 0.9 (0.6) and
the Chl-a values increased by 0.5 (0.7) mg m
−3 within 8 to 16 days, but the coastal
upwelling decreased. The temporal developments of the other four observed strong
storms were similar to these both events. Between 2000 and 2008 many other Saharan
storms were identified, but only these six events caused a biological response.