

90
W. Alpers
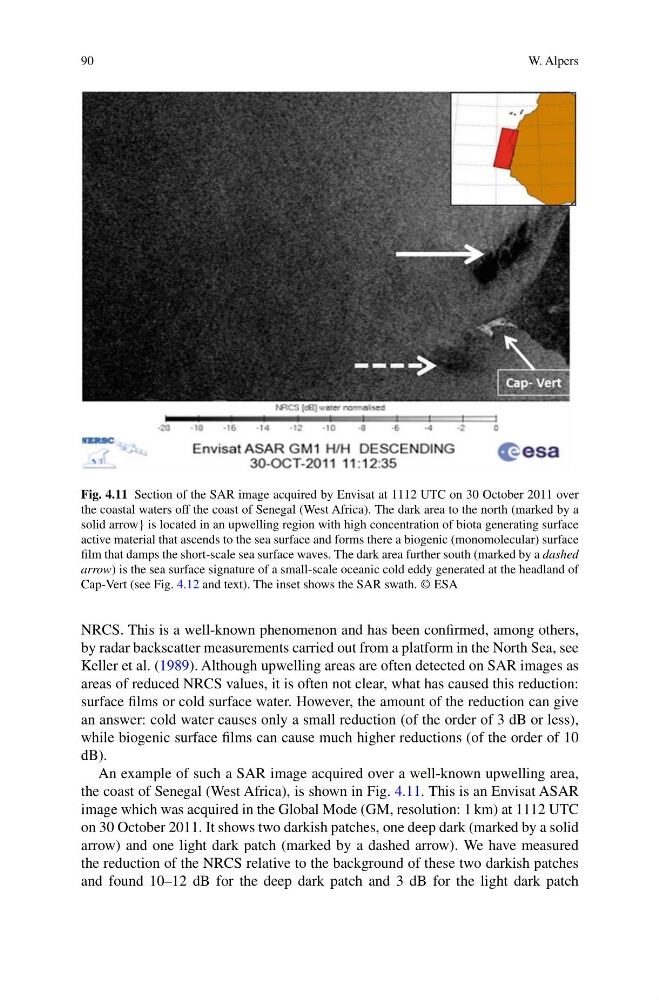
Fig. 4.11 Section of the SAR image acquired by Envisat at 1112 UTC on 30 October 2011 over
the coastal waters off the coast of Senegal (West Africa). The dark area to the north (marked by a
solid arrow} is located in an upwelling region with high concentration of biota generating surface
active material that ascends to the sea surface and forms there a biogenic (monomolecular) surface
film that damps the short-scale sea surface waves. The dark area further south (marked by a dashed
arrow) is the sea surface signature of a small-scale oceanic cold eddy generated at the headland of
Cap-Vert (see Fig. 4.12 and text). The inset shows the SAR swath. © ESA
NRCS. This is a well-known phenomenon and has been confirmed, among others,
by radar backscatter measurements carried out from a platform in the North Sea, see
Keller et al. (1989). Although upwelling areas are often detected on SAR images as
areas of reduced NRCS values, it is often not clear, what has caused this reduction:
surface films or cold surface water. However, the amount of the reduction can give
an answer: cold water causes only a small reduction (of the order of 3 dB or less),
while biogenic surface films can cause much higher reductions (of the order of 10
dB).
An example of such a SAR image acquired over a well-known upwelling area,
the coast of Senegal (West Africa), is shown in Fig. 4.11. This is an Envisat ASAR
image which was acquired in the Global Mode (GM, resolution: 1 km) at 1112 UTC
on 30 October 2011. It shows two darkish patches, one deep dark (marked by a solid
arrow) and one light dark patch (marked by a dashed arrow). We have measured
the reduction of the NRCS relative to the background of these two darkish patches
and found 10–12 dB for the deep dark patch and 3 dB for the light dark patch
W. Alpers
Fig. 4.11 Section of the SAR image acquired by Envisat at 1112 UTC on 30 October 2011 over
the coastal waters off the coast of Senegal (West Africa). The dark area to the north (marked by a
solid arrow} is located in an upwelling region with high concentration of biota generating surface
active material that ascends to the sea surface and forms there a biogenic (monomolecular) surface
film that damps the short-scale sea surface waves. The dark area further south (marked by a dashed
arrow) is the sea surface signature of a small-scale oceanic cold eddy generated at the headland of
Cap-Vert (see Fig. 4.12 and text). The inset shows the SAR swath. © ESA
NRCS. This is a well-known phenomenon and has been confirmed, among others,
by radar backscatter measurements carried out from a platform in the North Sea, see
Keller et al. (1989). Although upwelling areas are often detected on SAR images as
areas of reduced NRCS values, it is often not clear, what has caused this reduction:
surface films or cold surface water. However, the amount of the reduction can give
an answer: cold water causes only a small reduction (of the order of 3 dB or less),
while biogenic surface films can cause much higher reductions (of the order of 10
dB).
An example of such a SAR image acquired over a well-known upwelling area,
the coast of Senegal (West Africa), is shown in Fig. 4.11. This is an Envisat ASAR
image which was acquired in the Global Mode (GM, resolution: 1 km) at 1112 UTC
on 30 October 2011. It shows two darkish patches, one deep dark (marked by a solid
arrow) and one light dark patch (marked by a dashed arrow). We have measured
the reduction of the NRCS relative to the background of these two darkish patches
and found 10–12 dB for the deep dark patch and 3 dB for the light dark patch