

4 Remote Sensing of African Coastal Waters Using Active Microwaves Instrument
91
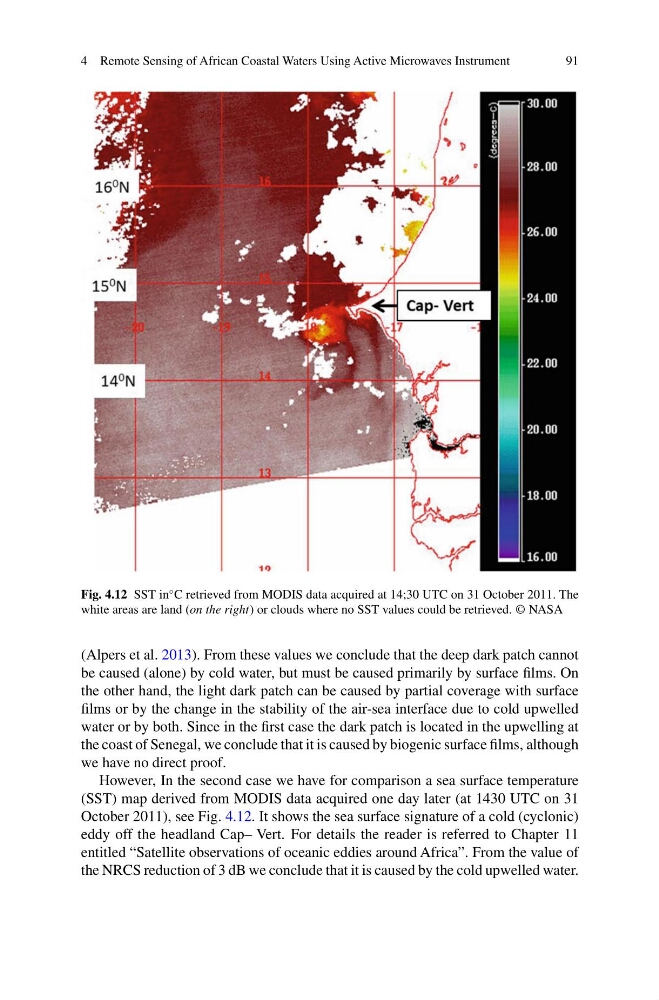
Fig. 4.12 SST in
◦ C retrieved from MODIS data acquired at 14;30 UTC on 31 October 2011. The
white areas are land (on the right) or clouds where no SST values could be retrieved. © NASA
(Alpers et al. 2013). From these values we conclude that the deep dark patch cannot
be caused (alone) by cold water, but must be caused primarily by surface films. On
the other hand, the light dark patch can be caused by partial coverage with surface
films or by the change in the stability of the air-sea interface due to cold upwelled
water or by both. Since in the first case the dark patch is located in the upwelling at
the coast of Senegal, we conclude that it is caused by biogenic surface films, although
we have no direct proof.
However, In the second case we have for comparison a sea surface temperature
(SST) map derived from MODIS data acquired one day later (at 1430 UTC on 31
October 2011), see Fig. 4.12. It shows the sea surface signature of a cold (cyclonic)
eddy off the headland Cap– Vert. For details the reader is referred to Chapter 11
entitled “Satellite observations of oceanic eddies around Africa”. From the value of
the NRCS reduction of 3 dB we conclude that it is caused by the cold upwelled water.
91
Fig. 4.12 SST in
◦ C retrieved from MODIS data acquired at 14;30 UTC on 31 October 2011. The
white areas are land (on the right) or clouds where no SST values could be retrieved. © NASA
(Alpers et al. 2013). From these values we conclude that the deep dark patch cannot
be caused (alone) by cold water, but must be caused primarily by surface films. On
the other hand, the light dark patch can be caused by partial coverage with surface
films or by the change in the stability of the air-sea interface due to cold upwelled
water or by both. Since in the first case the dark patch is located in the upwelling at
the coast of Senegal, we conclude that it is caused by biogenic surface films, although
we have no direct proof.
However, In the second case we have for comparison a sea surface temperature
(SST) map derived from MODIS data acquired one day later (at 1430 UTC on 31
October 2011), see Fig. 4.12. It shows the sea surface signature of a cold (cyclonic)
eddy off the headland Cap– Vert. For details the reader is referred to Chapter 11
entitled “Satellite observations of oceanic eddies around Africa”. From the value of
the NRCS reduction of 3 dB we conclude that it is caused by the cold upwelled water.