

84
W. Alpers
Fig. 4.4 Streamlines
associated with a nonlinear
atmospheric gravity wave
behind a mountain range (lee
wave). In the shadowed
region, the airflow associated
with the wave is opposite to
the ambient wind direction
(adapted from Doyle and
Durran 2002). Here the wind
direction is defined as the
direction into which the wind
is blowing
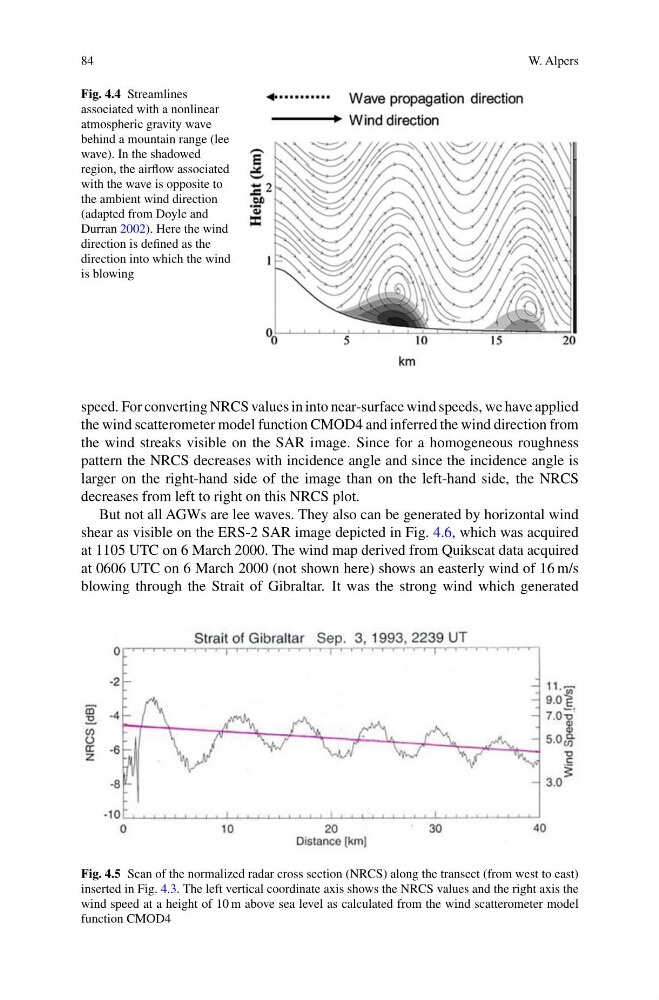
speed. For converting NRCS values in into near-surface wind speeds, we have applied
the wind scatterometer model function CMOD4 and inferred the wind direction from
the wind streaks visible on the SAR image. Since for a homogeneous roughness
pattern the NRCS decreases with incidence angle and since the incidence angle is
larger on the right-hand side of the image than on the left-hand side, the NRCS
decreases from left to right on this NRCS plot.
But not all AGWs are lee waves. They also can be generated by horizontal wind
shear as visible on the ERS-2 SAR image depicted in Fig. 4.6, which was acquired
at 1105 UTC on 6 March 2000. The wind map derived from Quikscat data acquired
at 0606 UTC on 6 March 2000 (not shown here) shows an easterly wind of 16 m/s
blowing through the Strait of Gibraltar. It was the strong wind which generated
Fig. 4.5 Scan of the normalized radar cross section (NRCS) along the transect (from west to east)
inserted in Fig. 4.3. The left vertical coordinate axis shows the NRCS values and the right axis the
wind speed at a height of 10 m above sea level as calculated from the wind scatterometer model
function CMOD4
W. Alpers
Fig. 4.4 Streamlines
associated with a nonlinear
atmospheric gravity wave
behind a mountain range (lee
wave). In the shadowed
region, the airflow associated
with the wave is opposite to
the ambient wind direction
(adapted from Doyle and
Durran 2002). Here the wind
direction is defined as the
direction into which the wind
is blowing
speed. For converting NRCS values in into near-surface wind speeds, we have applied
the wind scatterometer model function CMOD4 and inferred the wind direction from
the wind streaks visible on the SAR image. Since for a homogeneous roughness
pattern the NRCS decreases with incidence angle and since the incidence angle is
larger on the right-hand side of the image than on the left-hand side, the NRCS
decreases from left to right on this NRCS plot.
But not all AGWs are lee waves. They also can be generated by horizontal wind
shear as visible on the ERS-2 SAR image depicted in Fig. 4.6, which was acquired
at 1105 UTC on 6 March 2000. The wind map derived from Quikscat data acquired
at 0606 UTC on 6 March 2000 (not shown here) shows an easterly wind of 16 m/s
blowing through the Strait of Gibraltar. It was the strong wind which generated
Fig. 4.5 Scan of the normalized radar cross section (NRCS) along the transect (from west to east)
inserted in Fig. 4.3. The left vertical coordinate axis shows the NRCS values and the right axis the
wind speed at a height of 10 m above sea level as calculated from the wind scatterometer model
function CMOD4