

4 Remote Sensing of African Coastal Waters Using Active Microwaves Instrument
83
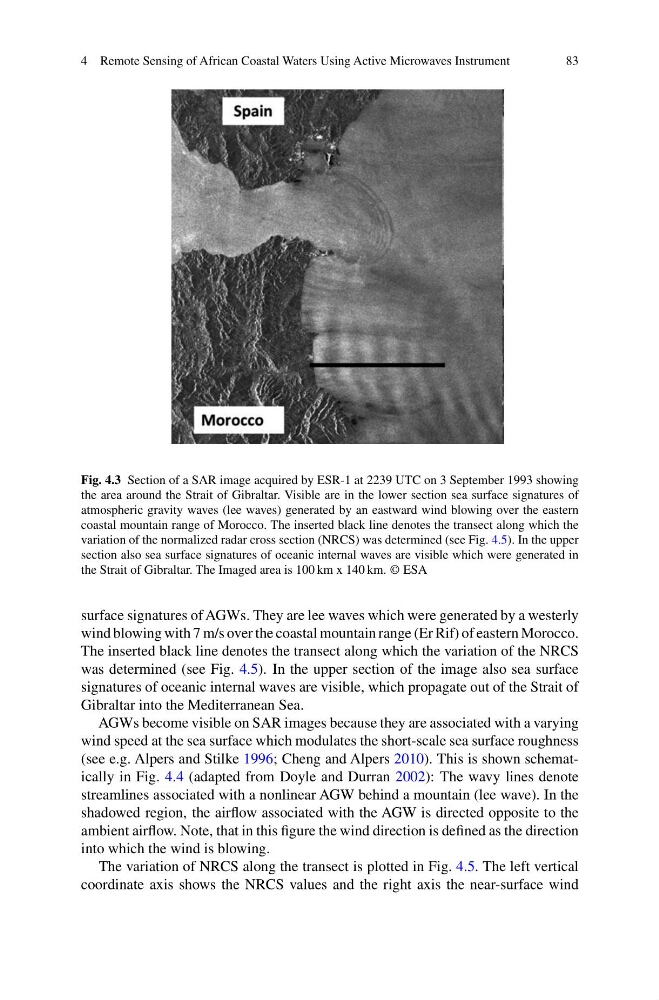
Fig. 4.3 Section of a SAR image acquired by ESR-1 at 2239 UTC on 3 September 1993 showing
the area around the Strait of Gibraltar. Visible are in the lower section sea surface signatures of
atmospheric gravity waves (lee waves) generated by an eastward wind blowing over the eastern
coastal mountain range of Morocco. The inserted black line denotes the transect along which the
variation of the normalized radar cross section (NRCS) was determined (see Fig. 4.5). In the upper
section also sea surface signatures of oceanic internal waves are visible which were generated in
the Strait of Gibraltar. The Imaged area is 100 km x 140 km. © ESA
surface signatures of AGWs. They are lee waves which were generated by a westerly
wind blowing with 7 m/s over the coastal mountain range (Er Rif) of eastern Morocco.
The inserted black line denotes the transect along which the variation of the NRCS
was determined (see Fig. 4.5). In the upper section of the image also sea surface
signatures of oceanic internal waves are visible, which propagate out of the Strait of
Gibraltar into the Mediterranean Sea.
AGWs become visible on SAR images because they are associated with a varying
wind speed at the sea surface which modulates the short-scale sea surface roughness
(see e.g. Alpers and Stilke 1996; Cheng and Alpers 2010). This is shown schematically in Fig. 4.4 (adapted from Doyle and Durran 2002): The wavy lines denote
streamlines associated with a nonlinear AGW behind a mountain (lee wave). In the
shadowed region, the airflow associated with the AGW is directed opposite to the
ambient airflow. Note, that in this figure the wind direction is defined as the direction
into which the wind is blowing.
The variation of NRCS along the transect is plotted in Fig. 4.5. The left vertical
coordinate axis shows the NRCS values and the right axis the near-surface wind
83
Fig. 4.3 Section of a SAR image acquired by ESR-1 at 2239 UTC on 3 September 1993 showing
the area around the Strait of Gibraltar. Visible are in the lower section sea surface signatures of
atmospheric gravity waves (lee waves) generated by an eastward wind blowing over the eastern
coastal mountain range of Morocco. The inserted black line denotes the transect along which the
variation of the normalized radar cross section (NRCS) was determined (see Fig. 4.5). In the upper
section also sea surface signatures of oceanic internal waves are visible which were generated in
the Strait of Gibraltar. The Imaged area is 100 km x 140 km. © ESA
surface signatures of AGWs. They are lee waves which were generated by a westerly
wind blowing with 7 m/s over the coastal mountain range (Er Rif) of eastern Morocco.
The inserted black line denotes the transect along which the variation of the NRCS
was determined (see Fig. 4.5). In the upper section of the image also sea surface
signatures of oceanic internal waves are visible, which propagate out of the Strait of
Gibraltar into the Mediterranean Sea.
AGWs become visible on SAR images because they are associated with a varying
wind speed at the sea surface which modulates the short-scale sea surface roughness
(see e.g. Alpers and Stilke 1996; Cheng and Alpers 2010). This is shown schematically in Fig. 4.4 (adapted from Doyle and Durran 2002): The wavy lines denote
streamlines associated with a nonlinear AGW behind a mountain (lee wave). In the
shadowed region, the airflow associated with the AGW is directed opposite to the
ambient airflow. Note, that in this figure the wind direction is defined as the direction
into which the wind is blowing.
The variation of NRCS along the transect is plotted in Fig. 4.5. The left vertical
coordinate axis shows the NRCS values and the right axis the near-surface wind