

5.1 Three-Age-Cohort M odel and Fishing
81
1: SHORT YEAR a 1
1:1'600.00
2:
3:
2: SHORT YEAR 1 2
3: SHORT YEAR 2 3
,,4(;2
2: ': 1
3:
0.00 +-------+-----....,....-----....-----......
0.00
20.00
40.00
Years
60.00
80.00
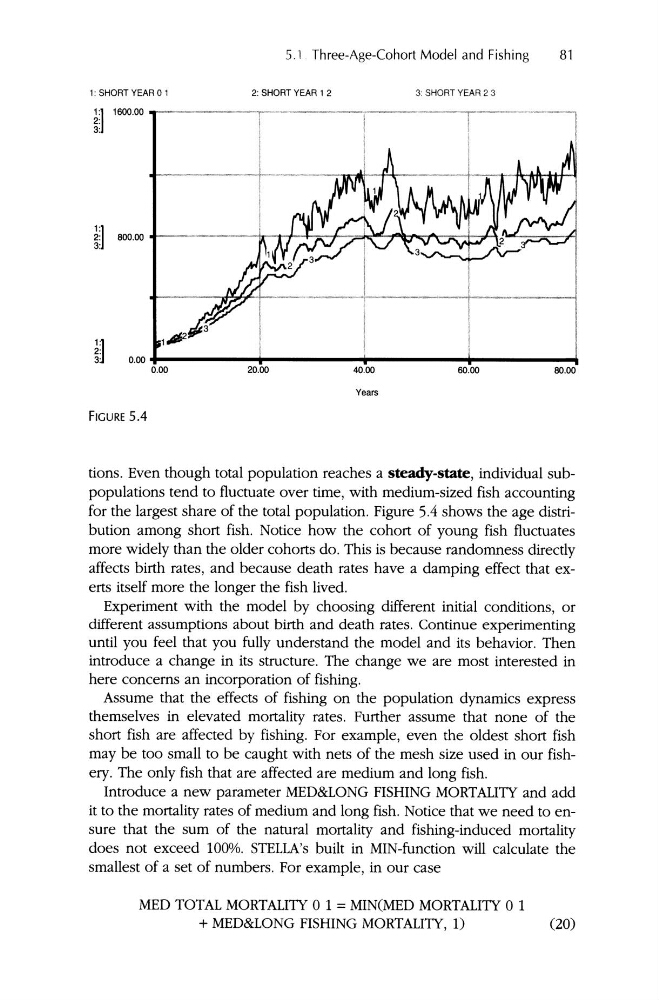
FIGURE 5.4
tions. Even though total popul ation reaches a steady-state, individual subpopulations tend to fluctuate ove r time, with medium-sized fish accounting
for the largest share of the total popul ation . Figure 5.4 shows the age distribution among short fish. Notice how the cohort of young fish fluctuates
more widely than the older cohorts do. This is because randomn ess directly
affects birth rates, and beca use death rates have a damping effect that exerts itself more the longer the fish lived .
Exp eriment with the model by choos ing different initial conditions, or
different assumptions about birth and death rates. Continue experimenting
until you feel that you fully understand the model and its beh avior. Then
introdu ce a change in its structure. The change we are most interested in
here concerns an incorporation of fishing.
Assume that the effects of fishing on the popul ation dynamics express
themselves in elevated mortality rates. Further assume that none of the
short fish are affected by fishing. For example, even the oldest short fish
may be too small to be caught with nets of the mesh size used in our fishery. The only fish that are affected are medium and long fish .
Introduce a new parameter MED&LONG FISHING MORTALITI and add
it to the mortality rates of medium and long fish. Notice that we need to ensure that the sum of the natural mortality and fishing-induced mortality
does not exceed 100%. STELLA's built in MIN-function will calculate the
smallest of a set of num bers. For example, in our case
MED TOTAL MORTALITI 0 1 = MIN(MED MORTALITI 0 1
+ MED&LONG FISHING MORTALITI, 1)
(20)
81
1: SHORT YEAR a 1
1:1'600.00
2:
3:
2: SHORT YEAR 1 2
3: SHORT YEAR 2 3
,,4(;2
2: ': 1
3:
0.00 +-------+-----....,....-----....-----......
0.00
20.00
40.00
Years
60.00
80.00
FIGURE 5.4
tions. Even though total popul ation reaches a steady-state, individual subpopulations tend to fluctuate ove r time, with medium-sized fish accounting
for the largest share of the total popul ation . Figure 5.4 shows the age distribution among short fish. Notice how the cohort of young fish fluctuates
more widely than the older cohorts do. This is because randomn ess directly
affects birth rates, and beca use death rates have a damping effect that exerts itself more the longer the fish lived .
Exp eriment with the model by choos ing different initial conditions, or
different assumptions about birth and death rates. Continue experimenting
until you feel that you fully understand the model and its beh avior. Then
introdu ce a change in its structure. The change we are most interested in
here concerns an incorporation of fishing.
Assume that the effects of fishing on the popul ation dynamics express
themselves in elevated mortality rates. Further assume that none of the
short fish are affected by fishing. For example, even the oldest short fish
may be too small to be caught with nets of the mesh size used in our fishery. The only fish that are affected are medium and long fish .
Introduce a new parameter MED&LONG FISHING MORTALITI and add
it to the mortality rates of medium and long fish. Notice that we need to ensure that the sum of the natural mortality and fishing-induced mortality
does not exceed 100%. STELLA's built in MIN-function will calculate the
smallest of a set of num bers. For example, in our case
MED TOTAL MORTALITI 0 1 = MIN(MED MORTALITI 0 1
+ MED&LONG FISHING MORTALITI, 1)
(20)