

80
5. Impact of Fishing Pressure on Mean Length of Fish
+ SHORT BIRTH RATE 2 3 • (I /3) • (I-RAND SHORT 2 3)
• SHORT YEAR 2 3
+ MED BIRTH RATE 1 2 • .5 • (I-RAND MED 1 2) • MED YEAR 1 2
+ MED BIRTH RATE 2 3 • .5 • (I-RAND MED 23) • MED YEAR 2 3. (I9)
Let us assume first that there is no fishing. In that case, we have all the
relevant model components specified. We introduce fishing-induced increases in mortality below .
Before you run the model, ask yourself:
What do I expect to happen with the size of the population over time?
Will it reach a maximum and level out, or will it show significant long-term
fluctuations?
Will any of the age cohorts or subpopulations come to dominate? If so,
which of them will stabilize, and why?
Provide qualitative answers to your questions to improve your ability to
better understand dynamic systems, and to help you better understand your
model. If you have not carefully thought about the model behavior before
you run a model, you may be easily swayed to believe the results, and may
perhaps not be aware of some anomalous behavior-behavior that may
have been caused by an inappropriate assumption, an error in laying out the
model, or a misspecification of the interrelations among its different parts.
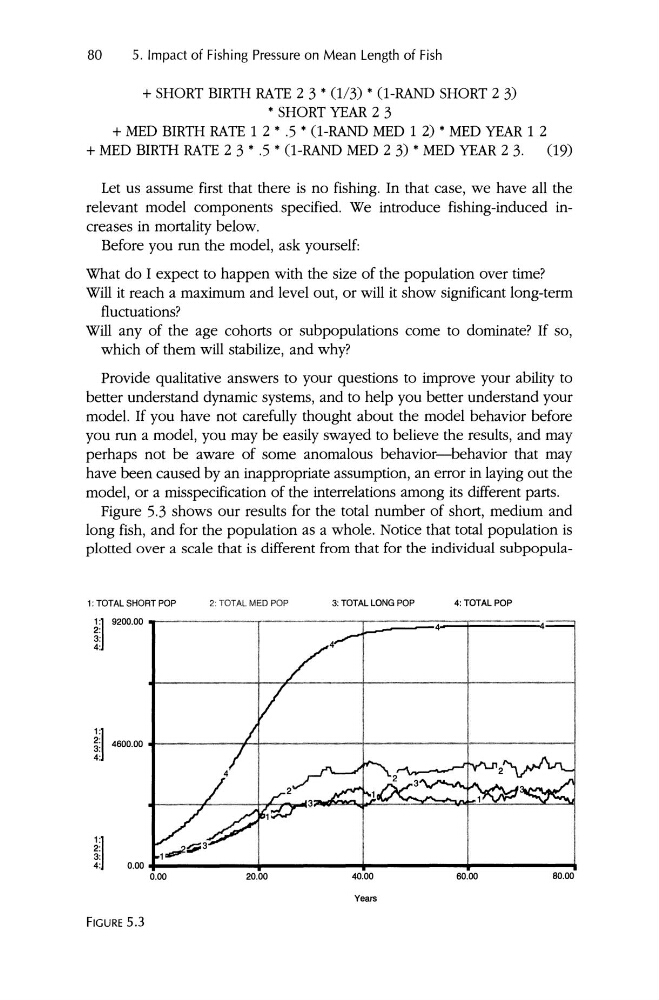
Figure 5.3 shows our results for the total number of short, medium and
long fish, and for the population as a whole . Notice that total population is
plotted over a scale that is different from that for the individual subpopula1: TOTALSHORTPOP
1: 1 9200.00
2: TOTAL MEDPOP
2:
3:
4:
i:j46oo. oo 01-- - - - ++-- - - - - + - - - - - + - - - - - -1
4:
3:
4:
0.00 +------.....-----.....-----.....-----....
0.00
20.00
40.00
Years
60.00
60.00
FIGURE 5.3
5. Impact of Fishing Pressure on Mean Length of Fish
+ SHORT BIRTH RATE 2 3 • (I /3) • (I-RAND SHORT 2 3)
• SHORT YEAR 2 3
+ MED BIRTH RATE 1 2 • .5 • (I-RAND MED 1 2) • MED YEAR 1 2
+ MED BIRTH RATE 2 3 • .5 • (I-RAND MED 23) • MED YEAR 2 3. (I9)
Let us assume first that there is no fishing. In that case, we have all the
relevant model components specified. We introduce fishing-induced increases in mortality below .
Before you run the model, ask yourself:
What do I expect to happen with the size of the population over time?
Will it reach a maximum and level out, or will it show significant long-term
fluctuations?
Will any of the age cohorts or subpopulations come to dominate? If so,
which of them will stabilize, and why?
Provide qualitative answers to your questions to improve your ability to
better understand dynamic systems, and to help you better understand your
model. If you have not carefully thought about the model behavior before
you run a model, you may be easily swayed to believe the results, and may
perhaps not be aware of some anomalous behavior-behavior that may
have been caused by an inappropriate assumption, an error in laying out the
model, or a misspecification of the interrelations among its different parts.
Figure 5.3 shows our results for the total number of short, medium and
long fish, and for the population as a whole . Notice that total population is
plotted over a scale that is different from that for the individual subpopula1: TOTALSHORTPOP
1: 1 9200.00
2: TOTAL MEDPOP
2:
3:
4:
i:j46oo. oo 01-- - - - ++-- - - - - + - - - - - + - - - - - -1
4:
3:
4:
0.00 +------.....-----.....-----.....-----....
0.00
20.00
40.00
Years
60.00
60.00
FIGURE 5.3