

82
5. Impact of Fishing Pressure on Mean Length of Fish
will not assume values larger than 1, and 1 if the sum of the two mortalities
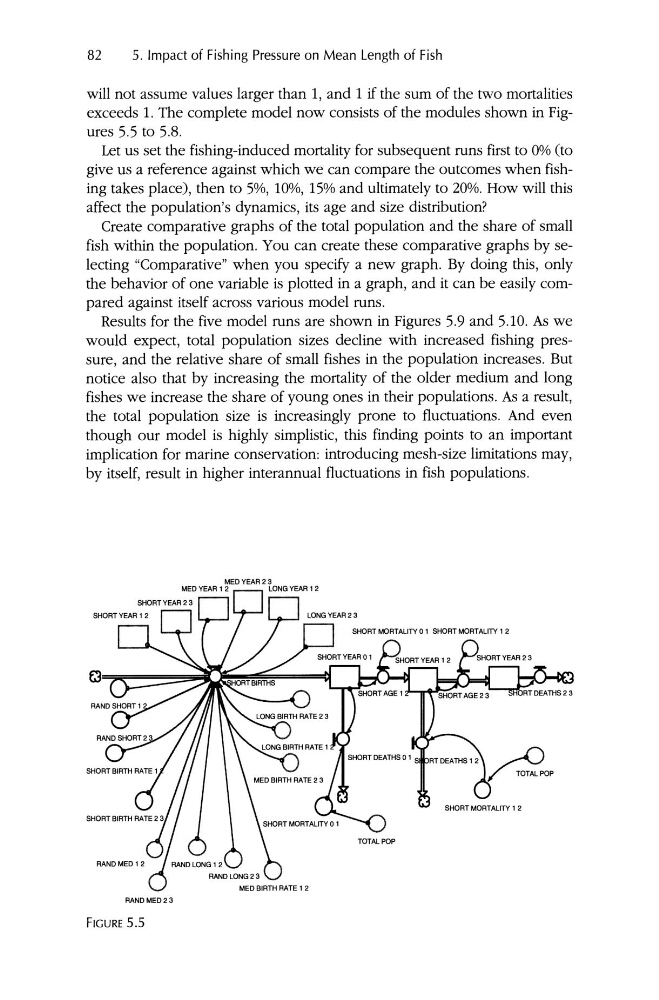
exceeds 1. The complete model now consists of the modules shown in Figures 5.5 to 5.8.
Let us set the fishing-induced mortality for subsequent runs first to 0% (to
give us a reference against which we can compare the outcomes when fishing takes place) , then to 5%, 10%, 15% and ultimately to 20%. How will this
affect the population's dynamics, its age and size distribution?
Create comparative graphs of the total population and the share of small
fish within the population. You can create these comparative graphs by selecting "Comparative" when you specify a new graph. By doing this, only
the behavior of one variable is plotted in a graph , and it can be easily compared against itself across various model runs .
Results for the five model runs are shown in Figures 5.9 and 5.10. As we
would expect, total population sizes decline with increased fishing pressure, and the relative share of small fishes in the population increases. But
notice also that by increasing the mortality of the older medium and long
fishes we increase the share of young ones in their populations. As a result,
the total population size is increasingly prone to fluctuations. And even
though our model is highly simplistic, this finding points to an important
implication for marine conservation: introducing mesh-size limitations may,
by itself, result in higher interannual fluctuations in fish populations.
MEO YEAR23
MED YEAR 1 2
SHORT YEAR 2 3
LONGYEAR 1 2
SHORT YEAR 1 2
RANDMED23
FIGURE 5.5
5. Impact of Fishing Pressure on Mean Length of Fish
will not assume values larger than 1, and 1 if the sum of the two mortalities
exceeds 1. The complete model now consists of the modules shown in Figures 5.5 to 5.8.
Let us set the fishing-induced mortality for subsequent runs first to 0% (to
give us a reference against which we can compare the outcomes when fishing takes place) , then to 5%, 10%, 15% and ultimately to 20%. How will this
affect the population's dynamics, its age and size distribution?
Create comparative graphs of the total population and the share of small
fish within the population. You can create these comparative graphs by selecting "Comparative" when you specify a new graph. By doing this, only
the behavior of one variable is plotted in a graph , and it can be easily compared against itself across various model runs .
Results for the five model runs are shown in Figures 5.9 and 5.10. As we
would expect, total population sizes decline with increased fishing pressure, and the relative share of small fishes in the population increases. But
notice also that by increasing the mortality of the older medium and long
fishes we increase the share of young ones in their populations. As a result,
the total population size is increasingly prone to fluctuations. And even
though our model is highly simplistic, this finding points to an important
implication for marine conservation: introducing mesh-size limitations may,
by itself, result in higher interannual fluctuations in fish populations.
MEO YEAR23
MED YEAR 1 2
SHORT YEAR 2 3
LONGYEAR 1 2
SHORT YEAR 1 2
RANDMED23
FIGURE 5.5