

18.5. Conclusion
405
4: Wild Shrimp Biom ass
, Actu.,1 Pr
2 harvesting
3 catching
1:
10.00..- - - - - - -r - - - - - - , - - -
1.508+009
4: 1.508+010
1:
4:
5.00
7.508+008 ,. - -
7.508+009
e::....
---'
-
0.00
0.00
0.00
1:
4:
+_
300.00
Months
.....
150.00
. -_ _ -:::::lllfIII==---l
-~
600 .00
r_
450.00
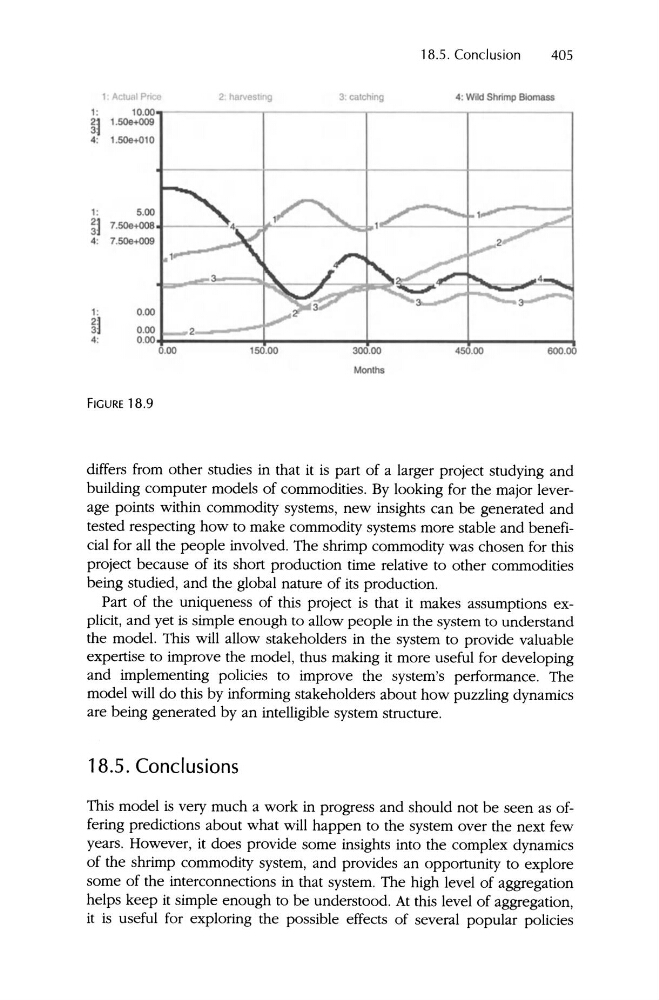
FIGURE 18.9
differs from othe r studies in that it is part of a larger project studying and
building computer models of commodities. By looking for the major leverage points within commodity systems, new insights can be generated and
tested respecting how to make commodity systems more stable and beneficial for all the people involved. The shrimp commodity was chosen for this
project because of its short produ ction time relative to other commodities
being studied , and the global nature of its production .
Part of the uniqueness of this project is that it makes assumptions explicit, and yet is simple enough to allow people in the system to understand
the model. This will allow stakeholders in the system to provide valuable
expertise to improve the model , thus making it more useful for developing
and implementing policies to improve the system's performance. The
model will do this by informing stakeholders about how puzzling dynamics
are being generated by an intelligible system structure .
18.5. Conclusions
This model is very much a wo rk in progress and should not be see n as offering predictions about what will happen to the system over the next few
years. However, it does provide some insights into the complex dynamics
of the shrimp commod ity system, and provides an opportunity to explore
some of the interconnections in that system. The high level of aggregation
helps keep it simple enough to be und erstood. At this level of aggregation,
it is useful for exploring the possible effects of several popul ar policies
405
4: Wild Shrimp Biom ass
, Actu.,1 Pr
2 harvesting
3 catching
1:
10.00..- - - - - - -r - - - - - - , - - -
1.508+009
4: 1.508+010
1:
4:
5.00
7.508+008 ,. - -
7.508+009
e::....
---'
-
0.00
0.00
0.00
1:
4:
+_
300.00
Months
.....
150.00
. -_ _ -:::::lllfIII==---l
-~
600 .00
r_
450.00
FIGURE 18.9
differs from othe r studies in that it is part of a larger project studying and
building computer models of commodities. By looking for the major leverage points within commodity systems, new insights can be generated and
tested respecting how to make commodity systems more stable and beneficial for all the people involved. The shrimp commodity was chosen for this
project because of its short produ ction time relative to other commodities
being studied , and the global nature of its production .
Part of the uniqueness of this project is that it makes assumptions explicit, and yet is simple enough to allow people in the system to understand
the model. This will allow stakeholders in the system to provide valuable
expertise to improve the model , thus making it more useful for developing
and implementing policies to improve the system's performance. The
model will do this by informing stakeholders about how puzzling dynamics
are being generated by an intelligible system structure .
18.5. Conclusions
This model is very much a wo rk in progress and should not be see n as offering predictions about what will happen to the system over the next few
years. However, it does provide some insights into the complex dynamics
of the shrimp commod ity system, and provides an opportunity to explore
some of the interconnections in that system. The high level of aggregation
helps keep it simple enough to be und erstood. At this level of aggregation,
it is useful for exploring the possible effects of several popul ar policies