

3: calchlng
4: Wild Sh rimp Biomass
1:
5.00
7.5Oe+008 ..
4: 7.5Oe+OO9
I :
4:
0.00
0.00 ....- - - - - + - - - - -.....-----......,1-----.......
0.00
0.00
150.00
300.00
Months
450.00
600.00
404
18. The Global Shrimp Market
1 Aclual P'Ice
2 harvesllng
1:
10.00..- - - - - -
1.5Oe+009
4: 1.5Oe+Ol0
FIGURE 18.8
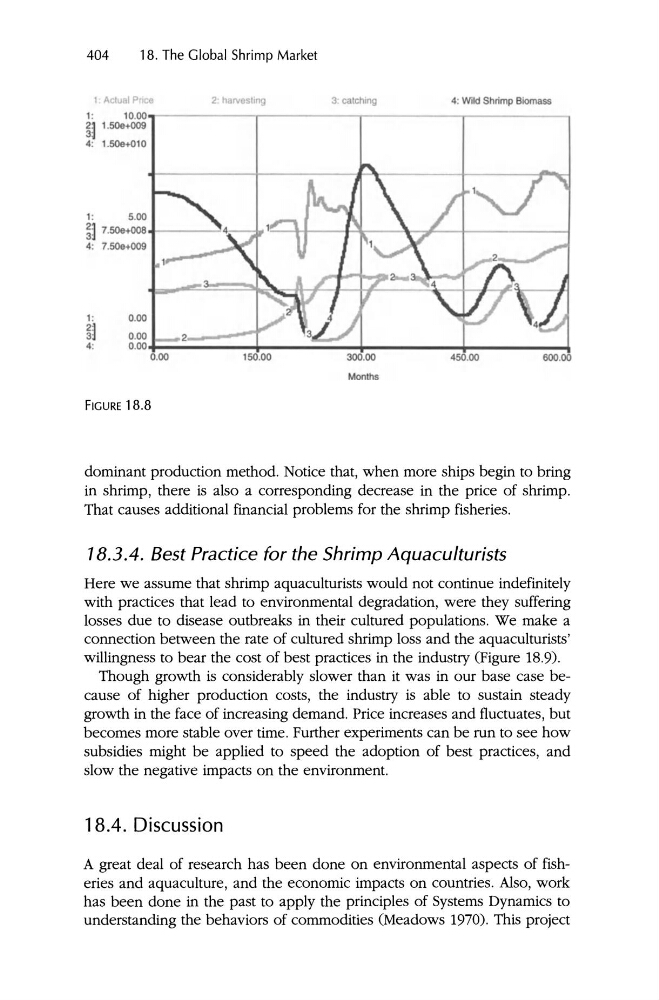
dominant production method. Notice that, when more ships begin to bring
in shrimp, there is also a corresponding decrease in the price of shrimp .
That causes additional financial problems for the shrimp fisheries.
18.3.4. Best Practice for the Shrimp Aquaculturists
Here we assume that shrimp aquaculturists would not continue indefinitely
with practices that lead to environmental degradation, were they suffering
losses due to disease outbreaks in their cultured populations. We make a
connection between the rate of cultured shrimp loss and the aquaculturists'
willingness to bear the cost of best practices in the industry (Figure 18.9).
Though growth is considerably slower than it was in our base case because of higher production costs, the industry is able to sustain steady
growth in the face of increasing demand. Price increases and fluctuates, but
becomes more stable over time. Further experiments can be run to see how
subsidies might be applied to speed the adoption of best practices , and
slow the negative impacts on the environment.
18.4. Discussion
A great deal of research has been done on environmental aspects of fisheries and aquaculture, and the economic impacts on countries. Also, work
has been done in the past to apply the principles of Systems Dynamics to
understanding the behaviors of commodities (Meadows 1970). This project
4: Wild Sh rimp Biomass
1:
5.00
7.5Oe+008 ..
4: 7.5Oe+OO9
I :
4:
0.00
0.00 ....- - - - - + - - - - -.....-----......,1-----.......
0.00
0.00
150.00
300.00
Months
450.00
600.00
404
18. The Global Shrimp Market
1 Aclual P'Ice
2 harvesllng
1:
10.00..- - - - - -
1.5Oe+009
4: 1.5Oe+Ol0
FIGURE 18.8
dominant production method. Notice that, when more ships begin to bring
in shrimp, there is also a corresponding decrease in the price of shrimp .
That causes additional financial problems for the shrimp fisheries.
18.3.4. Best Practice for the Shrimp Aquaculturists
Here we assume that shrimp aquaculturists would not continue indefinitely
with practices that lead to environmental degradation, were they suffering
losses due to disease outbreaks in their cultured populations. We make a
connection between the rate of cultured shrimp loss and the aquaculturists'
willingness to bear the cost of best practices in the industry (Figure 18.9).
Though growth is considerably slower than it was in our base case because of higher production costs, the industry is able to sustain steady
growth in the face of increasing demand. Price increases and fluctuates, but
becomes more stable over time. Further experiments can be run to see how
subsidies might be applied to speed the adoption of best practices , and
slow the negative impacts on the environment.
18.4. Discussion
A great deal of research has been done on environmental aspects of fisheries and aquaculture, and the economic impacts on countries. Also, work
has been done in the past to apply the principles of Systems Dynamics to
understanding the behaviors of commodities (Meadows 1970). This project