

400
18. The Global Shrimp Market
Vessels
shrimp per vessel
shrimpper hectare
profits fishery
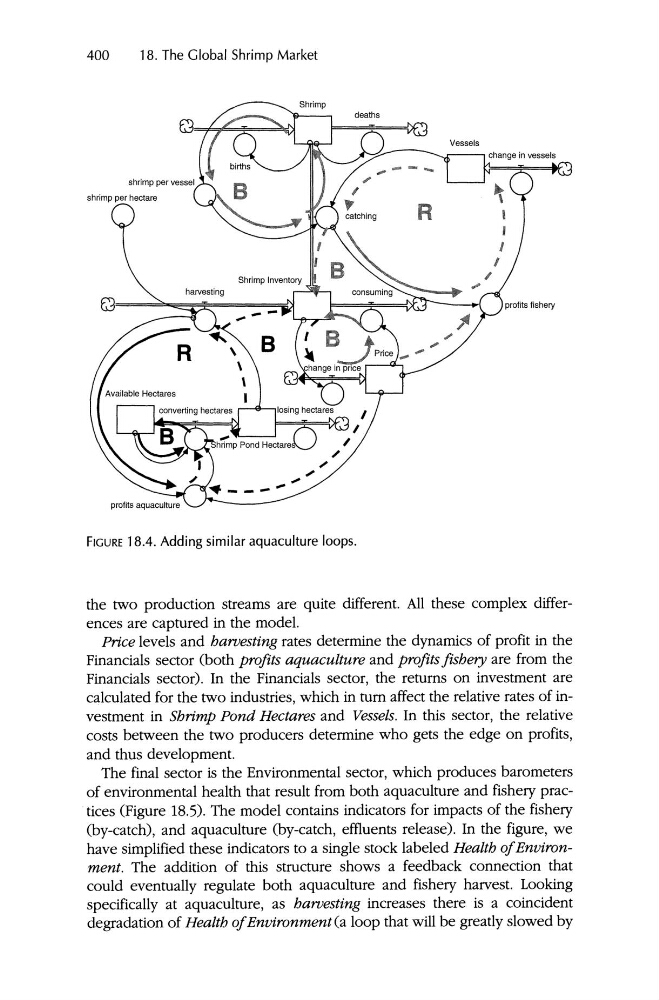
FIGURE 18.4. Adding similar aquaculture loops.
the two production streams are quite different. All these complex differences are captured in the model.
Price levels and baroesting rates determine the dynamics of profit in the
Financials sector (both profits aquaculture and profits fishery are from the
Financials sector). In the Financials sector, the returns on investment are
calculated for the two industries, which in tum affect the relative rates of investment in Shrimp Pond Hectares and Vessels. In this sector, the relative
costs between the two producers determine who gets the edge on profits,
and thus development.
The final sector is the Environmental sector , which produces barometers
of environmental health that result from both aquaculture and fishery prac.tices (Figure 18.5). The model contain s indicators for impacts of the fishery
(by-catch), and aquaculture (by-catch, effluents release). In the figure, we
have simplified these indicators to a single stock labeled Health ofEnvironment. The addition of this structure shows a feedback connection that
could eventuall y regulate both aquaculture and fishery harvest. Looking
specifically at aquaculture, as bartesting increases there is a coincident
degradation of Health ofEnvironment (a loop that will be greatly slowed by
18. The Global Shrimp Market
Vessels
shrimp per vessel
shrimpper hectare
profits fishery
FIGURE 18.4. Adding similar aquaculture loops.
the two production streams are quite different. All these complex differences are captured in the model.
Price levels and baroesting rates determine the dynamics of profit in the
Financials sector (both profits aquaculture and profits fishery are from the
Financials sector). In the Financials sector, the returns on investment are
calculated for the two industries, which in tum affect the relative rates of investment in Shrimp Pond Hectares and Vessels. In this sector, the relative
costs between the two producers determine who gets the edge on profits,
and thus development.
The final sector is the Environmental sector , which produces barometers
of environmental health that result from both aquaculture and fishery prac.tices (Figure 18.5). The model contain s indicators for impacts of the fishery
(by-catch), and aquaculture (by-catch, effluents release). In the figure, we
have simplified these indicators to a single stock labeled Health ofEnvironment. The addition of this structure shows a feedback connection that
could eventuall y regulate both aquaculture and fishery harvest. Looking
specifically at aquaculture, as bartesting increases there is a coincident
degradation of Health ofEnvironment (a loop that will be greatly slowed by