

264
13. Nile Perch Population Dynamics in Lake Victoria :
13.2.1.3. Fishery Module
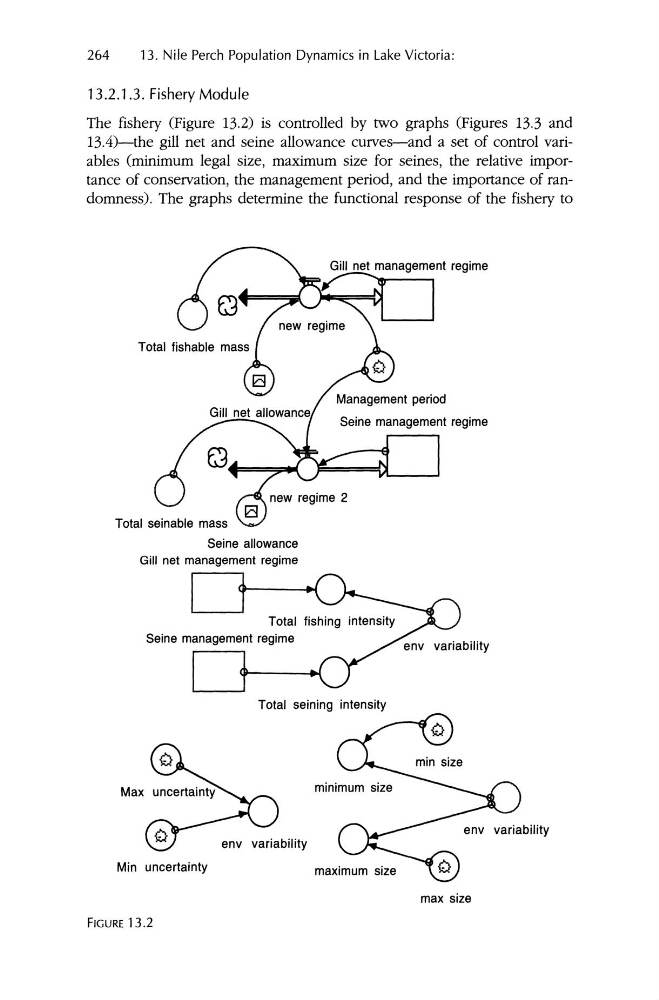
The fishery (Figure 13.2) is controlled by two graphs (Figures 13.3 and
13.4)-the gill net and seine allowance curves-and a set of control variables (minimum legal size, maximum size for seines, the relative importance of conservation, the management period, and the importance of randomness). The graphs determine the functional response of the fishery to
Total seinable mass
Seine allowance
Gill net management regime
Total seining intensity
Max
Min uncertainty
env variability
maximum size
max size
FIGURE 13.2
13. Nile Perch Population Dynamics in Lake Victoria :
13.2.1.3. Fishery Module
The fishery (Figure 13.2) is controlled by two graphs (Figures 13.3 and
13.4)-the gill net and seine allowance curves-and a set of control variables (minimum legal size, maximum size for seines, the relative importance of conservation, the management period, and the importance of randomness). The graphs determine the functional response of the fishery to
Total seinable mass
Seine allowance
Gill net management regime
Total seining intensity
Max
Min uncertainty
env variability
maximum size
max size
FIGURE 13.2