

- -
730.00
Days
.:_____ __ _ _
.
- -
1095.00
1460.00
1:
2:
0.00
0.00 1
0.00
.:.
5.00
30.00
1:
2:
180
9. Modeling Eelgrass (Zostera marina L.) Distributions in Great Bay
1: R&R 10Shoot
2' ShOOl lO R&R
2: 1:
60.00 10.00 ---------------- ------- - - -- - - - - - -- ----------- - - - - - - - - - - - - - - ----- - - - - - -
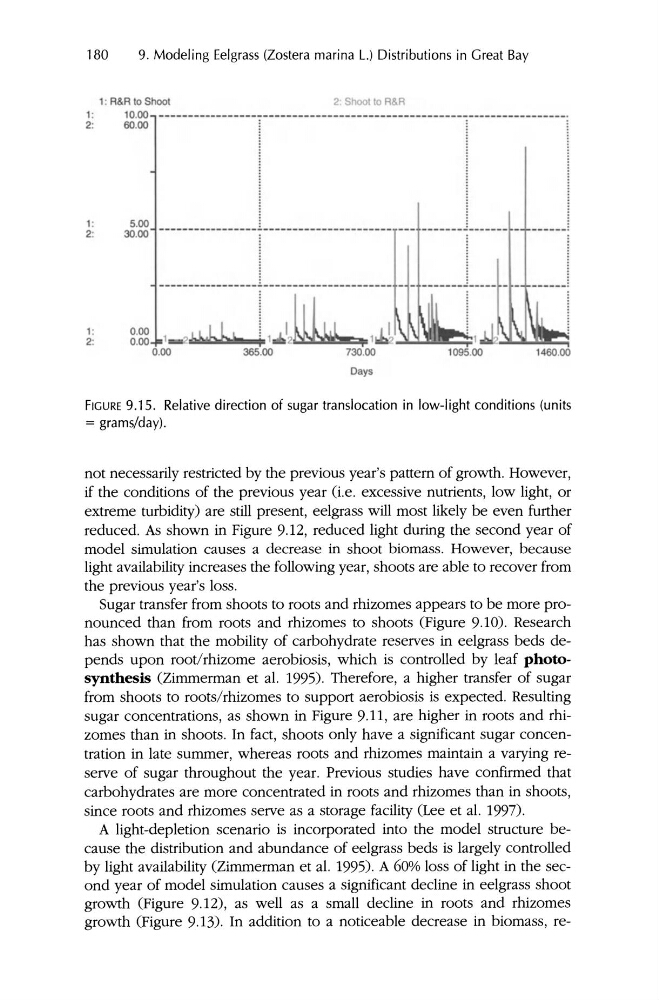
FIGURE 9.15. Relative direction of sugar translocation in low-light conditions (units
= grams/day).
not necessarily restricted by the previous year's pattern of growth . However,
if the conditions of the previous year (i.e. excessive nutrients, low light, or
extreme turbidity) are still present, eelgrass will most likely be even further
reduced. As shown in Figure 9.12, reduced light during the second year of
model simulation causes a decrease in shoot biomass . However, because
light availability increases the following year, shoots are able to recover from
the previous year's loss.
Sugar transfer from shoots to roots and rhizomes appears to be more pronounced than from roots and rhizomes to shoots (Figure 9.10). Research
has shown that the mobility of carbohydrate reserves in eelgrass beds depends upon root/rhizome aerobiosis, which is controlled by leaf photosynthesis (Zimmerman et al. 1995). Therefore, a higher transfer of sugar
from shoots to roots/rhizomes to support aerobiosis is expected. Resulting
sugar concentrations, as shown in Figure 9.11, are higher in roots and rhizomes than in shoots. In fact, shoots only have a significant sugar concentration in late summer, whereas roots and rhizomes maintain a varying reserve of sugar throughout the year. Previous studies have confirmed that
carbohydrates are more concentrated in roots and rhizomes than in shoots,
since roots and rhizomes serve as a storage facility (Lee et al. 1997).
A light-depletion scenario is incorporated into the model structure because the distribution and abundance of eelgrass beds is largely controlled
by light availability (Zimmerman et al. 1995). A 60% loss of light in the second year of model simulation causes a significant decline in eelgrass shoot
growth (Figure 9.12), as well as a small decline in roots and rhizomes
growth (Figure 9.13). In addition to a noticeable decrease in biomass , re-
730.00
Days
.:_____ __ _ _
.
- -
1095.00
1460.00
1:
2:
0.00
0.00 1
0.00
.:.
5.00
30.00
1:
2:
180
9. Modeling Eelgrass (Zostera marina L.) Distributions in Great Bay
1: R&R 10Shoot
2' ShOOl lO R&R
2: 1:
60.00 10.00 ---------------- ------- - - -- - - - - - -- ----------- - - - - - - - - - - - - - - ----- - - - - - -
FIGURE 9.15. Relative direction of sugar translocation in low-light conditions (units
= grams/day).
not necessarily restricted by the previous year's pattern of growth . However,
if the conditions of the previous year (i.e. excessive nutrients, low light, or
extreme turbidity) are still present, eelgrass will most likely be even further
reduced. As shown in Figure 9.12, reduced light during the second year of
model simulation causes a decrease in shoot biomass . However, because
light availability increases the following year, shoots are able to recover from
the previous year's loss.
Sugar transfer from shoots to roots and rhizomes appears to be more pronounced than from roots and rhizomes to shoots (Figure 9.10). Research
has shown that the mobility of carbohydrate reserves in eelgrass beds depends upon root/rhizome aerobiosis, which is controlled by leaf photosynthesis (Zimmerman et al. 1995). Therefore, a higher transfer of sugar
from shoots to roots/rhizomes to support aerobiosis is expected. Resulting
sugar concentrations, as shown in Figure 9.11, are higher in roots and rhizomes than in shoots. In fact, shoots only have a significant sugar concentration in late summer, whereas roots and rhizomes maintain a varying reserve of sugar throughout the year. Previous studies have confirmed that
carbohydrates are more concentrated in roots and rhizomes than in shoots,
since roots and rhizomes serve as a storage facility (Lee et al. 1997).
A light-depletion scenario is incorporated into the model structure because the distribution and abundance of eelgrass beds is largely controlled
by light availability (Zimmerman et al. 1995). A 60% loss of light in the second year of model simulation causes a significant decline in eelgrass shoot
growth (Figure 9.12), as well as a small decline in roots and rhizomes
growth (Figure 9.13). In addition to a noticeable decrease in biomass , re-