

9 Future Trends in Aquaculture Production
275
excluded. As can be seen, herbivore species like carps, barbels and other cyprinids
account for a major part of global aquaculture production in terms of volume, making
up 40% of the total volume. This is followed by production of oyster, clams and
other molluscs. With a 5% and 4% of total production volume respectively, shrimp
and prawns, on the one hand, and salmon and trout, on the other, account for a
modest share of aquaculture production. It is clear that aquaculture produces large
quantities of a substantial variety of species with carps, shellfish, shrimps as well
as finfish species on the top ten list.
Quite a different picture emerges when we look at the ranking of species in value
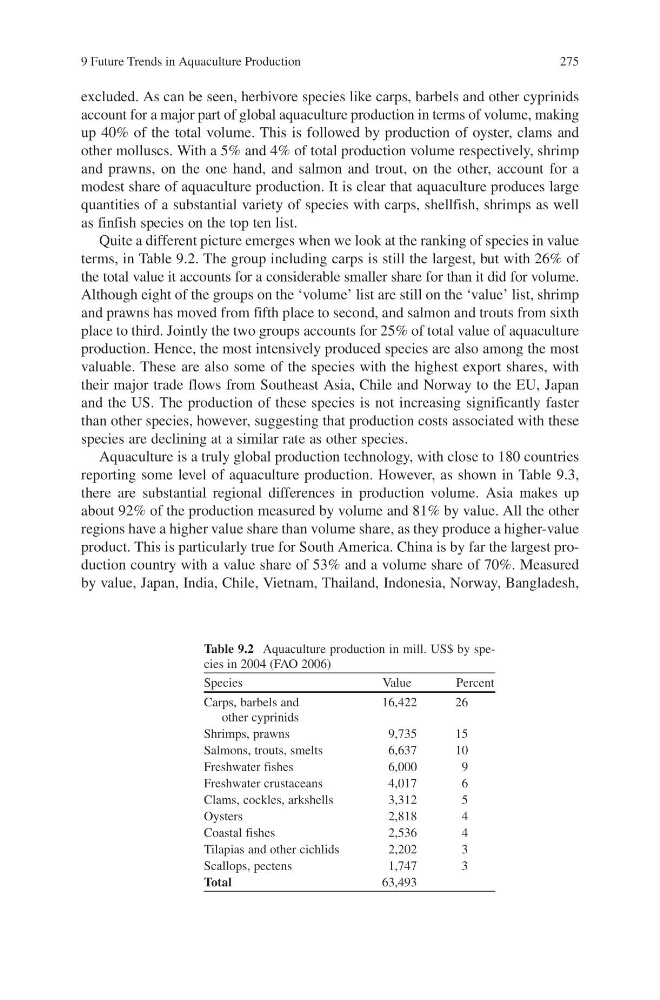
terms, in Table 9.2. The group including carps is still the largest, but with 26% of
the total value it accounts for a considerable smaller share for than it did for volume.
Although eight of the groups on the ‘volume’ list are still on the ‘value’ list, shrimp
and prawns has moved from fifth place to second, and salmon and trouts from sixth
place to third. Jointly the two groups accounts for 25% of total value of aquaculture
production. Hence, the most intensively produced species are also among the most
valuable. These are also some of the species with the highest export shares, with
their major trade flows from Southeast Asia, Chile and Norway to the EU, Japan
and the US. The production of these species is not increasing significantly faster
than other species, however, suggesting that production costs associated with these
species are declining at a similar rate as other species.
Aquaculture is a truly global production technology, with close to 180 countries
reporting some level of aquaculture production. However, as shown in Table 9.3,
there are substantial regional differences in production volume. Asia makes up
about 92% of the production measured by volume and 81% by value. All the other
regions have a higher value share than volume share, as they produce a higher-value
product. This is particularly true for South America. China is by far the largest production country with a value share of 53% and a volume share of 70%. Measured
by value, Japan, India, Chile, Vietnam, Thailand, Indonesia, Norway, Bangladesh,
Table 9.2 Aquaculture production in mill. US$ by species in 2004 (FAO 2006)
Species
Value
Percent
Carps, barbels and
16,422
26
other cyprinids
Shrimps, prawns
9,735
15
Salmons, trouts, smelts
6,637
10
Freshwater fishes
6,000
9
Freshwater crustaceans
4,017
6
Clams, cockles, arkshells
3,312
5
Oysters
2,818
4
Coastal fishes
2,536
4
Tilapias and other cichlids
2,202
3
Scallops, pectens
1,747
3
Total
63,493
275
excluded. As can be seen, herbivore species like carps, barbels and other cyprinids
account for a major part of global aquaculture production in terms of volume, making
up 40% of the total volume. This is followed by production of oyster, clams and
other molluscs. With a 5% and 4% of total production volume respectively, shrimp
and prawns, on the one hand, and salmon and trout, on the other, account for a
modest share of aquaculture production. It is clear that aquaculture produces large
quantities of a substantial variety of species with carps, shellfish, shrimps as well
as finfish species on the top ten list.
Quite a different picture emerges when we look at the ranking of species in value
terms, in Table 9.2. The group including carps is still the largest, but with 26% of
the total value it accounts for a considerable smaller share for than it did for volume.
Although eight of the groups on the ‘volume’ list are still on the ‘value’ list, shrimp
and prawns has moved from fifth place to second, and salmon and trouts from sixth
place to third. Jointly the two groups accounts for 25% of total value of aquaculture
production. Hence, the most intensively produced species are also among the most
valuable. These are also some of the species with the highest export shares, with
their major trade flows from Southeast Asia, Chile and Norway to the EU, Japan
and the US. The production of these species is not increasing significantly faster
than other species, however, suggesting that production costs associated with these
species are declining at a similar rate as other species.
Aquaculture is a truly global production technology, with close to 180 countries
reporting some level of aquaculture production. However, as shown in Table 9.3,
there are substantial regional differences in production volume. Asia makes up
about 92% of the production measured by volume and 81% by value. All the other
regions have a higher value share than volume share, as they produce a higher-value
product. This is particularly true for South America. China is by far the largest production country with a value share of 53% and a volume share of 70%. Measured
by value, Japan, India, Chile, Vietnam, Thailand, Indonesia, Norway, Bangladesh,
Table 9.2 Aquaculture production in mill. US$ by species in 2004 (FAO 2006)
Species
Value
Percent
Carps, barbels and
16,422
26
other cyprinids
Shrimps, prawns
9,735
15
Salmons, trouts, smelts
6,637
10
Freshwater fishes
6,000
9
Freshwater crustaceans
4,017
6
Clams, cockles, arkshells
3,312
5
Oysters
2,818
4
Coastal fishes
2,536
4
Tilapias and other cichlids
2,202
3
Scallops, pectens
1,747
3
Total
63,493