

276
F. Asche et al.
South Korea and Brazil are the other top-ten producing countries. Egypt is the largest
producer in Africa and is number 16 on the list. Hence, aquaculture is clearly
strongest in Southeast Asia, and is primarily conducted in developing countries.
9.3 Productivity Growth and Lower Production Costs
The success of aquaculture has led to substantial increases in production for several
species. A substantial increase in the production of a particular aquaculture species
usually results in a significant drop in the price of that species. For the production
to be profitable, technological innovations must take place to increase productivity
and reduce production cost. We will examine this process of change in this section,
focussing particularly on salmon since this is the species on which most research
has been conducted and for which most data are available. It is also the large-volume
species with the most intensive production practice, giving it the largest potential
for productivity improvements and the biggest challenges with respect to environmental sustainability. While conditions will vary in the production of other species,
most of the trends and relationships described in this section can be generalised to
other species.
9.3.1 Quantity Increase and Price Reduction
Shrimp and salmon are good examples of species where production increases have
been accompanied by price drops. Figure 9.2 shows the global production of
farmed shrimp and the real price for the period 1984 to 2004. Production in this
period increased from about 170,000 to 1.8 million tonnes. Prices were at their
highest in the late 1980s, at more than 10 US S/kg and then fell consistently, to
about US $5/kg in 2004. A similar trend is seen for Atlantic salmon over the period
1981 to 2004 (Fig. 9.3). Production of Atlantic salmon increased from about 20,000
tonnes in 1981 to about 1.6 million tonnes in 2004 and prices declined from a high of
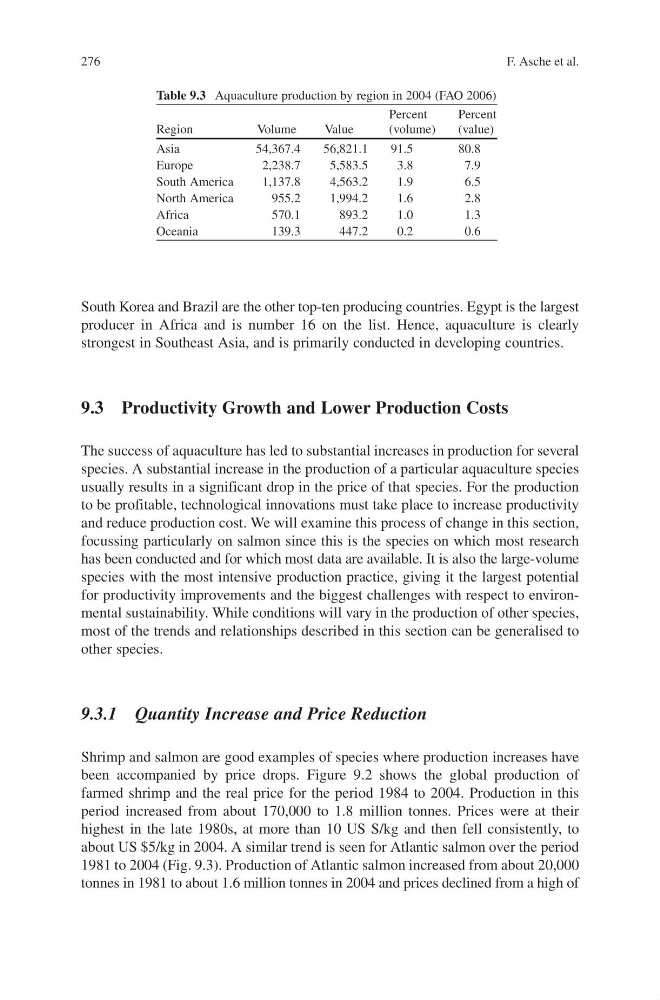
Table 9.3 Aquaculture production by region in 2004 (FAO 2006)
Percent
Percent
Region
Volume
Value
(volume)
(value)
Asia
54,367.4
56,821.1
91.5
80.8
Europe
2,238.7
5,583.5
3.8
7.9
South America
1,137.8
4,563.2
1.9
6.5
North America
955.2
1,994.2
1.6
2.8
Africa
570.1
893.2
1.0
1.3
Oceania
139.3
447.2
0.2
0.6
F. Asche et al.
South Korea and Brazil are the other top-ten producing countries. Egypt is the largest
producer in Africa and is number 16 on the list. Hence, aquaculture is clearly
strongest in Southeast Asia, and is primarily conducted in developing countries.
9.3 Productivity Growth and Lower Production Costs
The success of aquaculture has led to substantial increases in production for several
species. A substantial increase in the production of a particular aquaculture species
usually results in a significant drop in the price of that species. For the production
to be profitable, technological innovations must take place to increase productivity
and reduce production cost. We will examine this process of change in this section,
focussing particularly on salmon since this is the species on which most research
has been conducted and for which most data are available. It is also the large-volume
species with the most intensive production practice, giving it the largest potential
for productivity improvements and the biggest challenges with respect to environmental sustainability. While conditions will vary in the production of other species,
most of the trends and relationships described in this section can be generalised to
other species.
9.3.1 Quantity Increase and Price Reduction
Shrimp and salmon are good examples of species where production increases have
been accompanied by price drops. Figure 9.2 shows the global production of
farmed shrimp and the real price for the period 1984 to 2004. Production in this
period increased from about 170,000 to 1.8 million tonnes. Prices were at their
highest in the late 1980s, at more than 10 US S/kg and then fell consistently, to
about US $5/kg in 2004. A similar trend is seen for Atlantic salmon over the period
1981 to 2004 (Fig. 9.3). Production of Atlantic salmon increased from about 20,000
tonnes in 1981 to about 1.6 million tonnes in 2004 and prices declined from a high of
Table 9.3 Aquaculture production by region in 2004 (FAO 2006)
Percent
Percent
Region
Volume
Value
(volume)
(value)
Asia
54,367.4
56,821.1
91.5
80.8
Europe
2,238.7
5,583.5
3.8
7.9
South America
1,137.8
4,563.2
1.9
6.5
North America
955.2
1,994.2
1.6
2.8
Africa
570.1
893.2
1.0
1.3
Oceania
139.3
447.2
0.2
0.6