

62
P.P. Molloy et al.
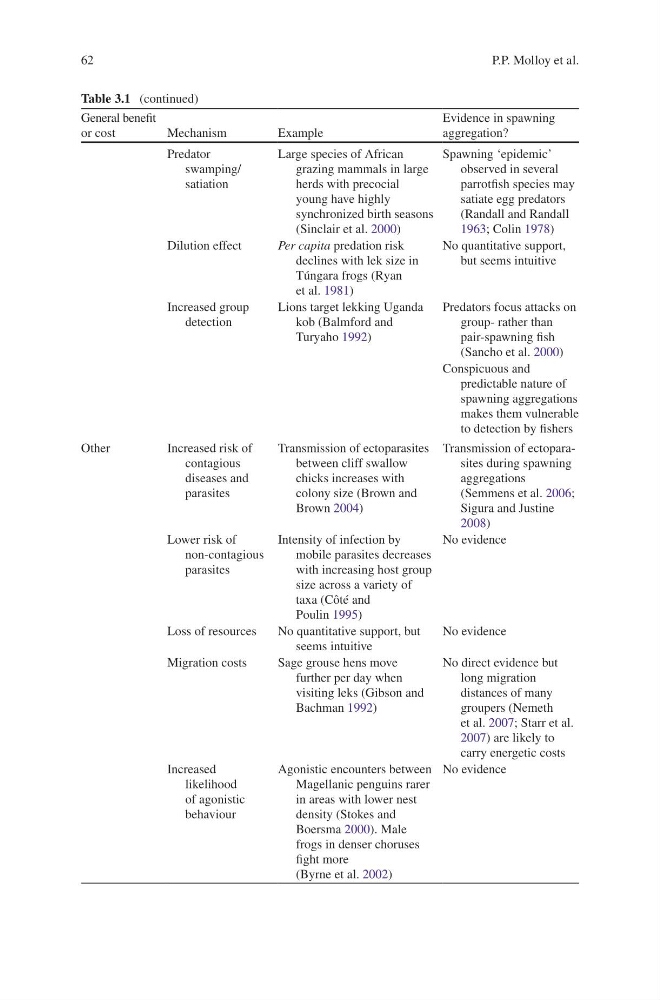
Table 3.1 (continued)
General benefi t
or cost
Mechanism
Example
Evidence in spawning
aggregation?
Predator
swamping/
satiation
Large species of African
grazing mammals in large
herds with precocial
young have highly
synchronized birth seasons
(Sinclair et al. 2000 )
Spawning ‘epidemic’
observed in several
parrotfi sh species may
satiate egg predators
(Randall and Randall
1963 ; Colin 1978 )
Dilution effect
Per capita predation risk
declines with lek size in
Túngara frogs (Ryan
et al. 1981 )
No quantitative support,
but seems intuitive
Increased group
detection
Lions target lekking Uganda
kob (Balmford and
Turyaho 1992 )
Predators focus attacks on
group- rather than
pair-spawning fi sh
(Sancho et al. 2000 )
Conspicuous and
predictable nature of
spawning aggregations
makes them vulnerable
to detection by fi shers
Other
Increased risk of
contagious
diseases and
parasites
Transmission of ectoparasites
between cliff swallow
chicks increases with
colony size (Brown and
Brown 2004 )
Transmission of ectoparasites during spawning
aggregations
(Semmens et al. 2006 ;
Sigura and Justine
2008 )
Lower risk of
non-contagious
parasites
Intensity of infection by
mobile parasites decreases
with increasing host group
size across a variety of
taxa (Côté and
Poulin 1995 )
No evidence
Loss of resources
No quantitative support, but
seems intuitive
No evidence
Migration costs
Sage grouse hens move
further per day when
visiting leks (Gibson and
Bachman 1992 )
No direct evidence but
long migration
distances of many
groupers (Nemeth
et al. 2007 ; Starr et al.
2007 ) are likely to
carry energetic costs
Increased
likelihood
of agonistic
behaviour
Agonistic encounters between
Magellanic penguins rarer
in areas with lower nest
density (Stokes and
Boersma 2000 ) . Male
frogs in denser choruses
fi ght more
(Byrne et al. 2002 )
No evidence
P.P. Molloy et al.
Table 3.1 (continued)
General benefi t
or cost
Mechanism
Example
Evidence in spawning
aggregation?
Predator
swamping/
satiation
Large species of African
grazing mammals in large
herds with precocial
young have highly
synchronized birth seasons
(Sinclair et al. 2000 )
Spawning ‘epidemic’
observed in several
parrotfi sh species may
satiate egg predators
(Randall and Randall
1963 ; Colin 1978 )
Dilution effect
Per capita predation risk
declines with lek size in
Túngara frogs (Ryan
et al. 1981 )
No quantitative support,
but seems intuitive
Increased group
detection
Lions target lekking Uganda
kob (Balmford and
Turyaho 1992 )
Predators focus attacks on
group- rather than
pair-spawning fi sh
(Sancho et al. 2000 )
Conspicuous and
predictable nature of
spawning aggregations
makes them vulnerable
to detection by fi shers
Other
Increased risk of
contagious
diseases and
parasites
Transmission of ectoparasites
between cliff swallow
chicks increases with
colony size (Brown and
Brown 2004 )
Transmission of ectoparasites during spawning
aggregations
(Semmens et al. 2006 ;
Sigura and Justine
2008 )
Lower risk of
non-contagious
parasites
Intensity of infection by
mobile parasites decreases
with increasing host group
size across a variety of
taxa (Côté and
Poulin 1995 )
No evidence
Loss of resources
No quantitative support, but
seems intuitive
No evidence
Migration costs
Sage grouse hens move
further per day when
visiting leks (Gibson and
Bachman 1992 )
No direct evidence but
long migration
distances of many
groupers (Nemeth
et al. 2007 ; Starr et al.
2007 ) are likely to
carry energetic costs
Increased
likelihood
of agonistic
behaviour
Agonistic encounters between
Magellanic penguins rarer
in areas with lower nest
density (Stokes and
Boersma 2000 ) . Male
frogs in denser choruses
fi ght more
(Byrne et al. 2002 )
No evidence