

540
12 Species Case Studies
followed by relatively low production in subsequent years (Fig. 12.72 ). The decline
after 1994 may be due to one or some cumulative results of fewer fi sh, fewer fi shers,
the impact of the national seasonal closure, limitations on exports, pollution, increased
boating activity impacting habitats and the 1998–1999 ENSO event. In 2006 the
Marine Protection Act was modifi ed to shift the closed season to February 1 to March
31, reducing the closure from 3 to 2 months, in order to allow fi shing during April
and May to increase landings of the fi sh. Overall the data have become less reliable
due to several problems, with recent years showing relatively large landings during
the closed season, an obvious fl aunting of the closed season regulation (Fig. 12.75 ).
The locations, sizes and numbers of PSAs were quantifi ed in Airai Bay from 2004
to 2006. At least two sites were surveyed at least twice a month with more intensive
monitoring (5 days/month) during the peak spring season. Two known sites (sites 1
and 2 with similar numbers and densities of PSAs) were selected for study in 2004
based upon an earlier study (Kitalong and Oiterong 1992 ) with additional sites based
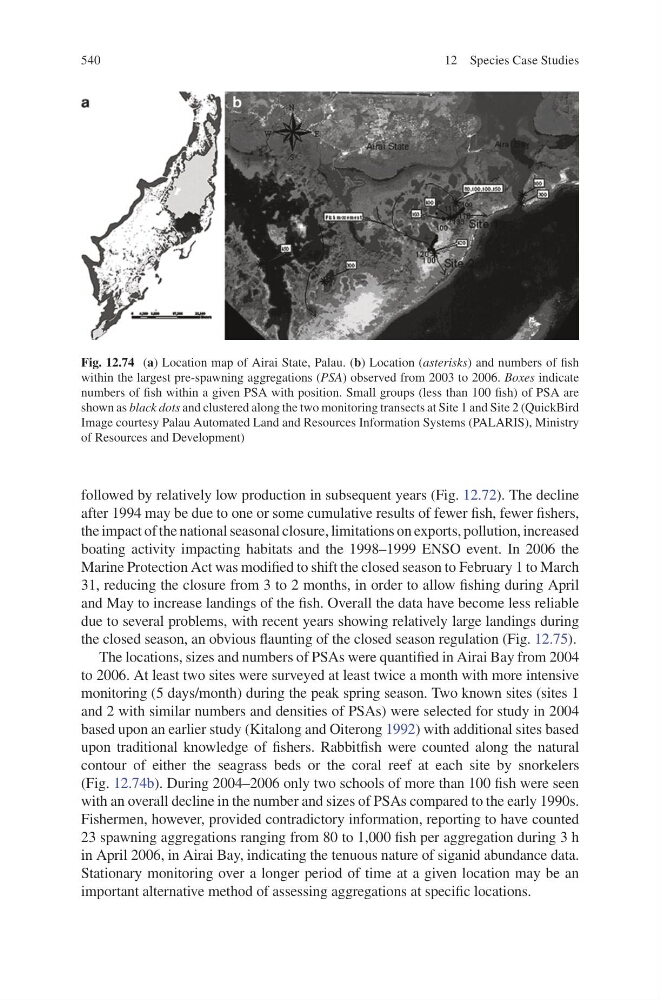
upon traditional knowledge of fi shers. Rabbitfi sh were counted along the natural
contour of either the seagrass beds or the coral reef at each site by snorkelers
(Fig. 12.74b ). During 2004–2006 only two schools of more than 100 fi sh were seen
with an overall decline in the number and sizes of PSAs compared to the early 1990s.
Fishermen, however, provided contradictory information, reporting to have counted
23 spawning aggregations ranging from 80 to 1,000 fi sh per aggregation during 3 h
in April 2006, in Airai Bay, indicating the tenuous nature of siganid abundance data.
Stationary monitoring over a longer period of time at a given location may be an
important alternative method of assessing aggregations at specifi c locations.
Fig. 12.74 ( a ) Location map of Airai State, Palau. ( b ) Location ( asterisks ) and numbers of fi sh
within the largest pre-spawning aggregations ( PSA ) observed from 2003 to 2006. Boxes indicate
numbers of fi sh within a given PSA with position. Small groups (less than 100 fi sh) of PSA are
shown as black dots and clustered along the two monitoring transects at Site 1 and Site 2 (QuickBird
Image courtesy Palau Automated Land and Resources Information Systems (PALARIS), Ministry
of Resources and Development)
12 Species Case Studies
followed by relatively low production in subsequent years (Fig. 12.72 ). The decline
after 1994 may be due to one or some cumulative results of fewer fi sh, fewer fi shers,
the impact of the national seasonal closure, limitations on exports, pollution, increased
boating activity impacting habitats and the 1998–1999 ENSO event. In 2006 the
Marine Protection Act was modifi ed to shift the closed season to February 1 to March
31, reducing the closure from 3 to 2 months, in order to allow fi shing during April
and May to increase landings of the fi sh. Overall the data have become less reliable
due to several problems, with recent years showing relatively large landings during
the closed season, an obvious fl aunting of the closed season regulation (Fig. 12.75 ).
The locations, sizes and numbers of PSAs were quantifi ed in Airai Bay from 2004
to 2006. At least two sites were surveyed at least twice a month with more intensive
monitoring (5 days/month) during the peak spring season. Two known sites (sites 1
and 2 with similar numbers and densities of PSAs) were selected for study in 2004
based upon an earlier study (Kitalong and Oiterong 1992 ) with additional sites based
upon traditional knowledge of fi shers. Rabbitfi sh were counted along the natural
contour of either the seagrass beds or the coral reef at each site by snorkelers
(Fig. 12.74b ). During 2004–2006 only two schools of more than 100 fi sh were seen
with an overall decline in the number and sizes of PSAs compared to the early 1990s.
Fishermen, however, provided contradictory information, reporting to have counted
23 spawning aggregations ranging from 80 to 1,000 fi sh per aggregation during 3 h
in April 2006, in Airai Bay, indicating the tenuous nature of siganid abundance data.
Stationary monitoring over a longer period of time at a given location may be an
important alternative method of assessing aggregations at specifi c locations.
Fig. 12.74 ( a ) Location map of Airai State, Palau. ( b ) Location ( asterisks ) and numbers of fi sh
within the largest pre-spawning aggregations ( PSA ) observed from 2003 to 2006. Boxes indicate
numbers of fi sh within a given PSA with position. Small groups (less than 100 fi sh) of PSA are
shown as black dots and clustered along the two monitoring transects at Site 1 and Site 2 (QuickBird
Image courtesy Palau Automated Land and Resources Information Systems (PALARIS), Ministry
of Resources and Development)