

155
9 Farming Costs and Benefits, Marketing Details, Investment Risks
T7 (500–800 g) for subadults and T3 (2,000–3,000 g) as well as T2 (3,000–4,000 g)
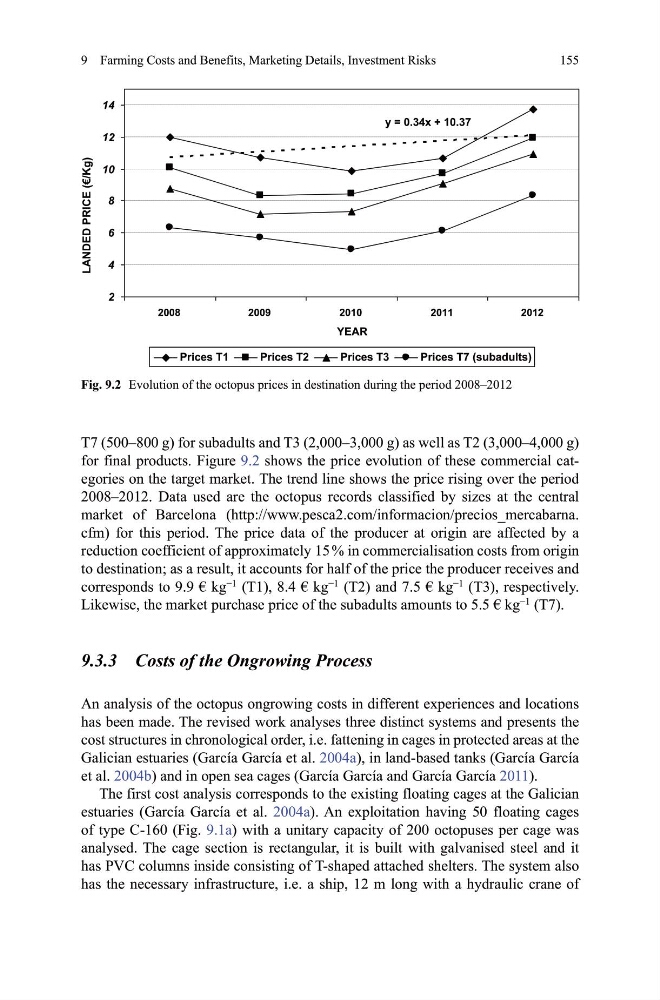
for final products. Figure 9.2 shows the price evolution of these commercial categories on the target market. The trend line shows the price rising over the period
2008–2012. Data used are the octopus records classified by sizes at the central
market of Barcelona (http://www.pesca2.com/informacion/precios_mercabarna.
cfm) for this period. The price data of the producer at origin are affected by a
reduction coefficient of approximately 15 % in commercialisation costs from origin
to destination; as a result, it accounts for half of the price the producer receives and
corresponds to 9.9 € kg
−1
(T1), 8.4 € kg
−1
(T2) and 7.5 € kg
−1
(T3), respectively.
Likewise, the market purchase price of the subadults amounts to 5.5 € kg
−1
(T7).
9.3.3 Costs of the Ongrowing Process
An analysis of the octopus ongrowing costs in different experiences and locations
has been made. The revised work analyses three distinct systems and presents the
cost structures in chronological order, i.e. fattening in cages in protected areas at the
Galician estuaries (García García et al. 2004a), in land-based tanks (García García
et al. 2004b) and in open sea cages (García García and García García 2011).
The first cost analysis corresponds to the existing floating cages at the Galician
estuaries (García García et al. 2004a). An exploitation having 50 floating cages
of type C-160 (Fig. 9.1a) with a unitary capacity of 200 octopuses per cage was
analysed. The cage section is rectangular, it is built with galvanised steel and it
has PVC columns inside consisting of T-shaped attached shelters. The system also
has the necessary infrastructure, i.e. a ship, 12 m long with a hydraulic crane of
\ [
<($5
/$1'('35,&(¼.J
3ULFHV7
3ULFHV7
3ULFHV7
3ULFHV7VXEDGXOWV
Fig. 9.2 Evolution of the octopus prices in destination during the period 2008–2012
9 Farming Costs and Benefits, Marketing Details, Investment Risks
T7 (500–800 g) for subadults and T3 (2,000–3,000 g) as well as T2 (3,000–4,000 g)
for final products. Figure 9.2 shows the price evolution of these commercial categories on the target market. The trend line shows the price rising over the period
2008–2012. Data used are the octopus records classified by sizes at the central
market of Barcelona (http://www.pesca2.com/informacion/precios_mercabarna.
cfm) for this period. The price data of the producer at origin are affected by a
reduction coefficient of approximately 15 % in commercialisation costs from origin
to destination; as a result, it accounts for half of the price the producer receives and
corresponds to 9.9 € kg
−1
(T1), 8.4 € kg
−1
(T2) and 7.5 € kg
−1
(T3), respectively.
Likewise, the market purchase price of the subadults amounts to 5.5 € kg
−1
(T7).
9.3.3 Costs of the Ongrowing Process
An analysis of the octopus ongrowing costs in different experiences and locations
has been made. The revised work analyses three distinct systems and presents the
cost structures in chronological order, i.e. fattening in cages in protected areas at the
Galician estuaries (García García et al. 2004a), in land-based tanks (García García
et al. 2004b) and in open sea cages (García García and García García 2011).
The first cost analysis corresponds to the existing floating cages at the Galician
estuaries (García García et al. 2004a). An exploitation having 50 floating cages
of type C-160 (Fig. 9.1a) with a unitary capacity of 200 octopuses per cage was
analysed. The cage section is rectangular, it is built with galvanised steel and it
has PVC columns inside consisting of T-shaped attached shelters. The system also
has the necessary infrastructure, i.e. a ship, 12 m long with a hydraulic crane of
\ [
<($5
/$1'('35,&(¼.J
3ULFHV7
3ULFHV7
3ULFHV7
3ULFHV7VXEDGXOWV
Fig. 9.2 Evolution of the octopus prices in destination during the period 2008–2012