

The mapping tool is designed to display estimates of cumulative consumptive
water use at the terminus of predetermined watersheds upstream of a watershed of
interest. The end user interacts with the system using a web browser and, upon first
page load, is presented with a web-mapping interface. When the user clicks on a
watershed, the system sends a query request to a backend database containing both
spatial and nonspatial data. The query extracts withdrawal data and consumptive
use estimates and returns a rendered map and summary calculations of withdrawals
and consumptive use upstream of the selected watershed. These results are
displayed to the end user in the form of a map with the upstream watersheds and
withdrawal sites highlighted, tables of information on those withdrawal sites, and
summary information on total water withdrawals and consumptive water use within
the originally selected watershed. The returned display also includes a chart of
withdrawals over time.
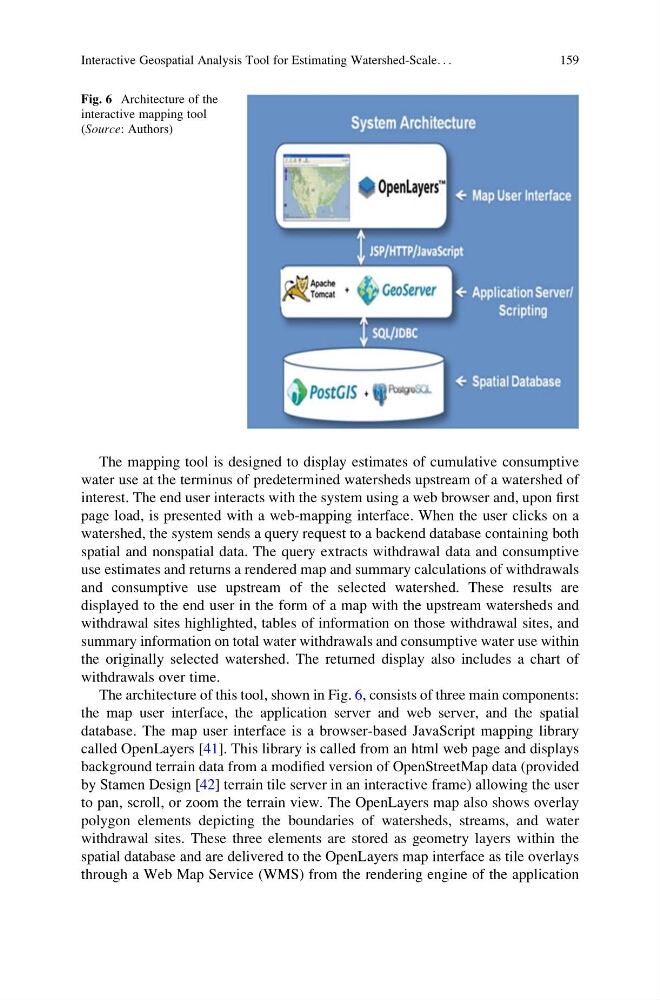
The architecture of this tool, shown in Fig. 6, consists of three main components:
the map user interface, the application server and web server, and the spatial
database. The map user interface is a browser-based JavaScript mapping library
called OpenLayers [41]. This library is called from an html web page and displays
background terrain data from a modified version of OpenStreetMap data (provided
by Stamen Design [42] terrain tile server in an interactive frame) allowing the user
to pan, scroll, or zoom the terrain view. The OpenLayers map also shows overlay
polygon elements depicting the boundaries of watersheds, streams, and water
withdrawal sites. These three elements are stored as geometry layers within the
spatial database and are delivered to the OpenLayers map interface as tile overlays
through a Web Map Service (WMS) from the rendering engine of the application
Fig. 6 Architecture of the
interactive mapping tool
(Source: Authors)
Interactive Geospatial Analysis Tool for Estimating Watershed-Scale. . .
159
water use at the terminus of predetermined watersheds upstream of a watershed of
interest. The end user interacts with the system using a web browser and, upon first
page load, is presented with a web-mapping interface. When the user clicks on a
watershed, the system sends a query request to a backend database containing both
spatial and nonspatial data. The query extracts withdrawal data and consumptive
use estimates and returns a rendered map and summary calculations of withdrawals
and consumptive use upstream of the selected watershed. These results are
displayed to the end user in the form of a map with the upstream watersheds and
withdrawal sites highlighted, tables of information on those withdrawal sites, and
summary information on total water withdrawals and consumptive water use within
the originally selected watershed. The returned display also includes a chart of
withdrawals over time.
The architecture of this tool, shown in Fig. 6, consists of three main components:
the map user interface, the application server and web server, and the spatial
database. The map user interface is a browser-based JavaScript mapping library
called OpenLayers [41]. This library is called from an html web page and displays
background terrain data from a modified version of OpenStreetMap data (provided
by Stamen Design [42] terrain tile server in an interactive frame) allowing the user
to pan, scroll, or zoom the terrain view. The OpenLayers map also shows overlay
polygon elements depicting the boundaries of watersheds, streams, and water
withdrawal sites. These three elements are stored as geometry layers within the
spatial database and are delivered to the OpenLayers map interface as tile overlays
through a Web Map Service (WMS) from the rendering engine of the application
Fig. 6 Architecture of the
interactive mapping tool
(Source: Authors)
Interactive Geospatial Analysis Tool for Estimating Watershed-Scale. . .
159