

24
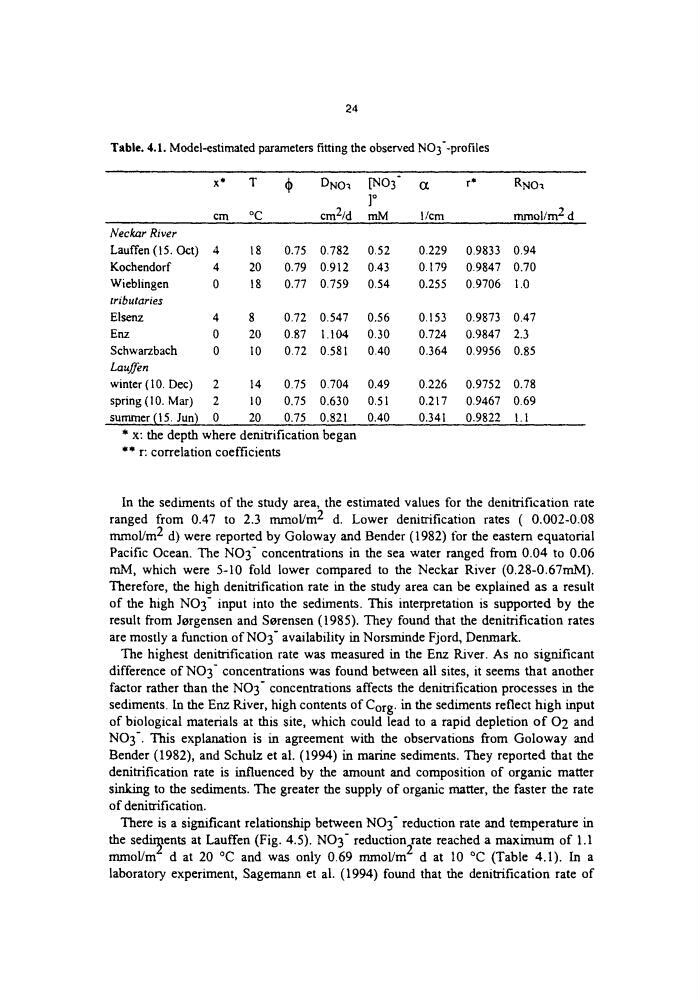
Table. 4.1. Model-estimated parameters fitting the observed NO3"-profiles
~
x*
T
t~
DNOa [NO3
Ot
]o
cm
~
cm2/d mM
l/cm
r*
RNOa
mmol/m 2 d
Neckar River
Lauffen (15. Oct) 4
18
0.75 0.782
0.52
0.229
0.9833 0.94
Kochendorf
4
20
0.79 0.912
0.43
0.179
0.9847 0.70
Wieblingen
0
18
0.77 0.759
0.54
0.255 0.9706 1.0
tributaries
Elsenz
4
8
0.72 0.547
0,56
0.153 0.9873 0.47
Enz
0
20
0.87 1.104 0.30
0.724
0.9847 2.3
Schwarzbach
0
10
0.72 0.581 0.40
0.364
0.9956 0.85
Lauffen
winter (I0. Dec)
2
14
0,75 0.704
0.49
0.226
0.9752 0.78
spring(10. Mar)
2
10
0.75 0.630
0.51
0.217
0.9467 0.69
summer.(15. ]u_n). 0
20
0.75.. 0.821 0.40
0.341 0.9822 1.1
* x: the depth where denitrification began
** r: correlation coefficients
In the sediments of the study area, the estimated values for the denitrification rate
ranged from 0.47 to 2.3 mmol/m 2 d. Lower deniwification rates ( 0.002-0.08
mmol/m 2 d) were reported by Goloway and Bender (1982) Ibr the eastern equatorial
Pacific Ocean. The NO3- concentrations in the sea water ranged from 0.04 to 0.06
raM, which were 5-10 fold lower compared to the Neckar River (0.28-0.67mM).
Therefore, the high denitrification rate in the study area can be explained as a result
of the high NO 3- input into the sediments. This interpretation is supported by the
result from Jorgensen and Sorensen (1985). They found that the denitrification rates
are mostly a function of NO3" availability in Norsminde Fjord, Denmark.
The highest denitrification rate was measured in the Enz River. As no significant
difference of NO3- concentrations was found between all sites, it seems that another
factor rather than the NO 3" concentrations affects the denitrification processes in the
sediments. In the Enz River, high contents of Corg. in the sediments reflect high input
of biological materials at this site, which could lead to a rapid depletion of 0 2 and
NO3". This explanation is in agreement with the observations from Goloway and
Bender (1982), and Schulz et al. (1994) in marine sediments. They reported that the
denitrification rate is influenced by the amount and composition of organic matter
sinking to the sediments. The greater the supply of organic matter, the faster the rate
of denitrification.
There is a significant relationship between NO 3" reduction rate and temperature in
the sedir~ents at Lauffen (Fig. 4.5). NO 3" reductionrate reached a maximum of 1.1
mmol/m d at 20 ~ and was only 0.69 mrnol/m z d at 10 ~ (Table 4.1). In a
laboratory experiment, Sagemann et al. (1994) found that the denitrification rate of
Table. 4.1. Model-estimated parameters fitting the observed NO3"-profiles
~
x*
T
t~
DNOa [NO3
Ot
]o
cm
~
cm2/d mM
l/cm
r*
RNOa
mmol/m 2 d
Neckar River
Lauffen (15. Oct) 4
18
0.75 0.782
0.52
0.229
0.9833 0.94
Kochendorf
4
20
0.79 0.912
0.43
0.179
0.9847 0.70
Wieblingen
0
18
0.77 0.759
0.54
0.255 0.9706 1.0
tributaries
Elsenz
4
8
0.72 0.547
0,56
0.153 0.9873 0.47
Enz
0
20
0.87 1.104 0.30
0.724
0.9847 2.3
Schwarzbach
0
10
0.72 0.581 0.40
0.364
0.9956 0.85
Lauffen
winter (I0. Dec)
2
14
0,75 0.704
0.49
0.226
0.9752 0.78
spring(10. Mar)
2
10
0.75 0.630
0.51
0.217
0.9467 0.69
summer.(15. ]u_n). 0
20
0.75.. 0.821 0.40
0.341 0.9822 1.1
* x: the depth where denitrification began
** r: correlation coefficients
In the sediments of the study area, the estimated values for the denitrification rate
ranged from 0.47 to 2.3 mmol/m 2 d. Lower deniwification rates ( 0.002-0.08
mmol/m 2 d) were reported by Goloway and Bender (1982) Ibr the eastern equatorial
Pacific Ocean. The NO3- concentrations in the sea water ranged from 0.04 to 0.06
raM, which were 5-10 fold lower compared to the Neckar River (0.28-0.67mM).
Therefore, the high denitrification rate in the study area can be explained as a result
of the high NO 3- input into the sediments. This interpretation is supported by the
result from Jorgensen and Sorensen (1985). They found that the denitrification rates
are mostly a function of NO3" availability in Norsminde Fjord, Denmark.
The highest denitrification rate was measured in the Enz River. As no significant
difference of NO3- concentrations was found between all sites, it seems that another
factor rather than the NO 3" concentrations affects the denitrification processes in the
sediments. In the Enz River, high contents of Corg. in the sediments reflect high input
of biological materials at this site, which could lead to a rapid depletion of 0 2 and
NO3". This explanation is in agreement with the observations from Goloway and
Bender (1982), and Schulz et al. (1994) in marine sediments. They reported that the
denitrification rate is influenced by the amount and composition of organic matter
sinking to the sediments. The greater the supply of organic matter, the faster the rate
of denitrification.
There is a significant relationship between NO 3" reduction rate and temperature in
the sedir~ents at Lauffen (Fig. 4.5). NO 3" reductionrate reached a maximum of 1.1
mmol/m d at 20 ~ and was only 0.69 mrnol/m z d at 10 ~ (Table 4.1). In a
laboratory experiment, Sagemann et al. (1994) found that the denitrification rate of