

23
The stoichiometry of biomass (plankton) in marine sediments can be described as
(CH20)106(NH3)16(H3PO4) (Froelich et al. 1979; Bemer 1980; Bal.zer 1989).
However, the ratio of elements C, N and P of the biomass in freshwater may be
different from that in ocean. The stoichiometry of the biomass in freshwater is given
by Sigg (1986): (CH20) 113(NH3) 15(H3PO4) based on her measurements using flux
chambers. The denitrification reaction can be described by
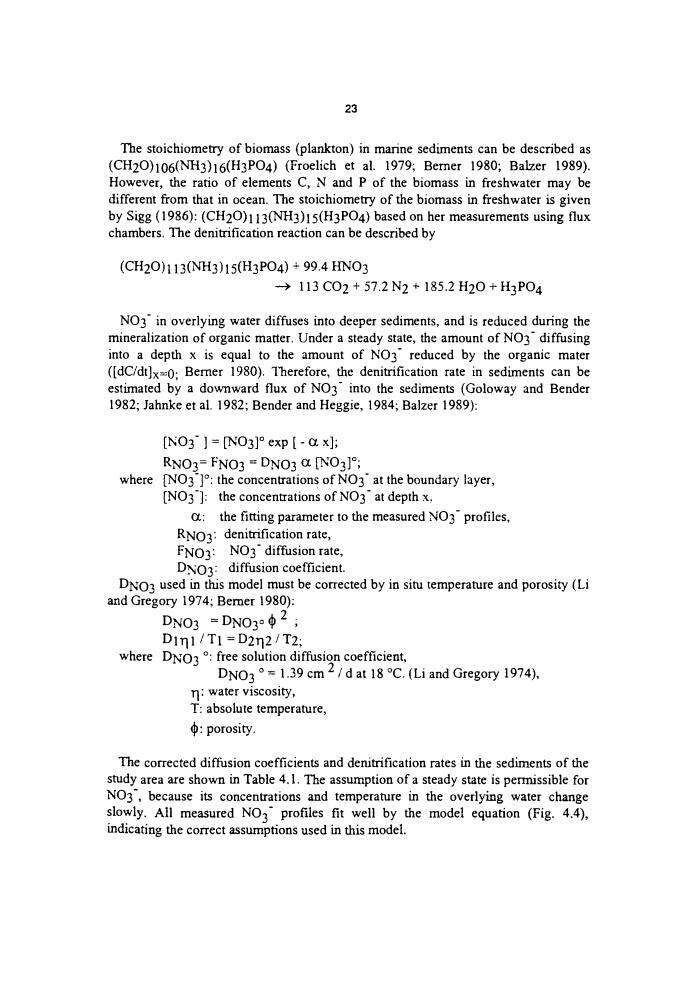
(CH20) 113(NH3) 15(H3PO4) + 99.4 HNO 3
113 CO2 + 57.2 N2 + 185.2 H20 + H3PO 4
NO 3- in overlying water diffuses into deeper sediments, and is reduced during the
mineralization of organic matter. Under a steady state, the amount of NO 3- diffusing
into a depth x is equal to the amount of NO 3" reduced by the organic mater
([dC/dt]x=0; Bemer 1980). Therefore, the denitrification rate in sediments can be
estimated by a downward flux of NO3" into the sediments (Goloway and Bender
1982; Jahnke et al. 1982; Bender and Heggie, 1984; Balzer 1989):
[NO 3- ] = [NO3] ~ exp [ - ct x];
RNO3 = FNO3 = DNO3 ~ [NO3]~
where [NO3-]~ the concentrations of NO 3- at the boundary layer,
[NO3-]: the concentrations of NO 3- at depth x,
(z: the fitting parameter to the measured NO3- profiles,
RNO3: denitrification rate,
FNO3: NO 3- diffusion rate,
DNO3: diffusion coefficient.
DNO3 used in this model must be corrected by in situ temperature and porosity (Li
and Gregory 1974; Bemer 1980):
DNO3 =DNO3 ~
.
Dlrll/T1 =D2rl2/T2;
where DNO3 ~ free solution diffusion coefficient,
DNO3 ~ = 1.39 cm 2 / d at 18 ~ (Li and Gregory 1974),
r I: water viscosity,
T: absolute temperature,
~: porosity.
The corrected diffusion coefficients and denitrification rates m the sediments of the
study area are shown in Table 4.1. The assumption of a steady state is permissible for
NO3", because its concentrations and temperature in the overlying water change
slowly. All measured NO 3- profiles fit well by the model equation (Fig. 4.4),
indicating the correct assumptions used in this model.
The stoichiometry of biomass (plankton) in marine sediments can be described as
(CH20)106(NH3)16(H3PO4) (Froelich et al. 1979; Bemer 1980; Bal.zer 1989).
However, the ratio of elements C, N and P of the biomass in freshwater may be
different from that in ocean. The stoichiometry of the biomass in freshwater is given
by Sigg (1986): (CH20) 113(NH3) 15(H3PO4) based on her measurements using flux
chambers. The denitrification reaction can be described by
(CH20) 113(NH3) 15(H3PO4) + 99.4 HNO 3
113 CO2 + 57.2 N2 + 185.2 H20 + H3PO 4
NO 3- in overlying water diffuses into deeper sediments, and is reduced during the
mineralization of organic matter. Under a steady state, the amount of NO 3- diffusing
into a depth x is equal to the amount of NO 3" reduced by the organic mater
([dC/dt]x=0; Bemer 1980). Therefore, the denitrification rate in sediments can be
estimated by a downward flux of NO3" into the sediments (Goloway and Bender
1982; Jahnke et al. 1982; Bender and Heggie, 1984; Balzer 1989):
[NO 3- ] = [NO3] ~ exp [ - ct x];
RNO3 = FNO3 = DNO3 ~ [NO3]~
where [NO3-]~ the concentrations of NO 3- at the boundary layer,
[NO3-]: the concentrations of NO 3- at depth x,
(z: the fitting parameter to the measured NO3- profiles,
RNO3: denitrification rate,
FNO3: NO 3- diffusion rate,
DNO3: diffusion coefficient.
DNO3 used in this model must be corrected by in situ temperature and porosity (Li
and Gregory 1974; Bemer 1980):
DNO3 =DNO3 ~
.
Dlrll/T1 =D2rl2/T2;
where DNO3 ~ free solution diffusion coefficient,
DNO3 ~ = 1.39 cm 2 / d at 18 ~ (Li and Gregory 1974),
r I: water viscosity,
T: absolute temperature,
~: porosity.
The corrected diffusion coefficients and denitrification rates m the sediments of the
study area are shown in Table 4.1. The assumption of a steady state is permissible for
NO3", because its concentrations and temperature in the overlying water change
slowly. All measured NO 3- profiles fit well by the model equation (Fig. 4.4),
indicating the correct assumptions used in this model.