

186
D. Markel and U. Shamir
5 Water Quality
Physical, chemical, and biological qualities of the water in the lake are the result
of a complex set of physical, chemical, and biological processes and interactions.
Space here does not allow elaboration, and the interested reader is referred to the
extensive literature of reports and scientific papers published regularly (Assouline
1993; Berman 1996a,b, 1998; Gophen et al. 1990; Walline et al. 1993). Other
references (some in Hebrew) can be found in the data-base of the Grand Water
Research Institute (http://v.Ti.technion.ac.il/cgi-biniabstract.html).
,Chlorld.
mg l-1
Total suspended
solids, m g l - 1
,Turb idity
NTU
• Tot.al phosphorus
9 L " ~
,Total nitrogen
mg L"
· Chlorophyll
9 L"~
,Prim;ary productlo
gC m -1 d "
• Cyanobacullfl a
01 tolol %
,Zoopla n klon
g m-2
,Fecal eolltorms
No l · 1
Water Quality
Rating
••
0.2
1
n
0
Wlnter·Sprlng
J.n, 2·Feb. 3-M ~H . 4-Apr, s..Msy, 6-Jun-1
107130
N;'
0 .• O.
~,
0.0 O.
4
• • I~
0.0 O.
~
I1..l.
2 3
~
0.1 0 .6 1 .1 1 .~
, f) •
~
f'''·'
26831 o 8
6 ,810.917. Glll.l
' .3 • . 3 7.2 8.2
I I I
40 48
••
S2
1.2 1," I .• I .'
38 61 106 179
b~2 3.1 Jj~
,~
,
'.7
•
•
Summur-Fall
Jul, a-Aug , 9.Sep, 10-0el, 11-NDY, 1Z-Dac-7
~ .
1U1tl9 1
.~"'~ . .
,tV/ 1
8
0
4 .' 6.0 7 .2
'.'
0.0 O. ii'i"""'; ;-;--;; 3 .• ' .3 5 .• 5.8
:.D.
7
1
2
3
27 44 12 116
Nii
0.0 o.
1.0 1.2 1.3
~,'
1. '
.-.,
, 6 10 18 32
t--+:--:-~~Il;d~~~~' ~ 20 "t-::--:t:;~;i!:i~~..-+-+_2-i7 ,.
•
6
9 '~'8' I
2
3 •
.3 8413'
) :. 0 100 150200250 ,.----='--.... 60 103 U6190
"
I 'l,,~,",p~ti~ I I I
o 20 .0 60 80 10080 6 0 40 20 0 a 20 40 80 80 1 00 80 60 40 20 0
th·90lh 0) & 25th·75th . . ) percontll .. of •• lues during 1969·199210
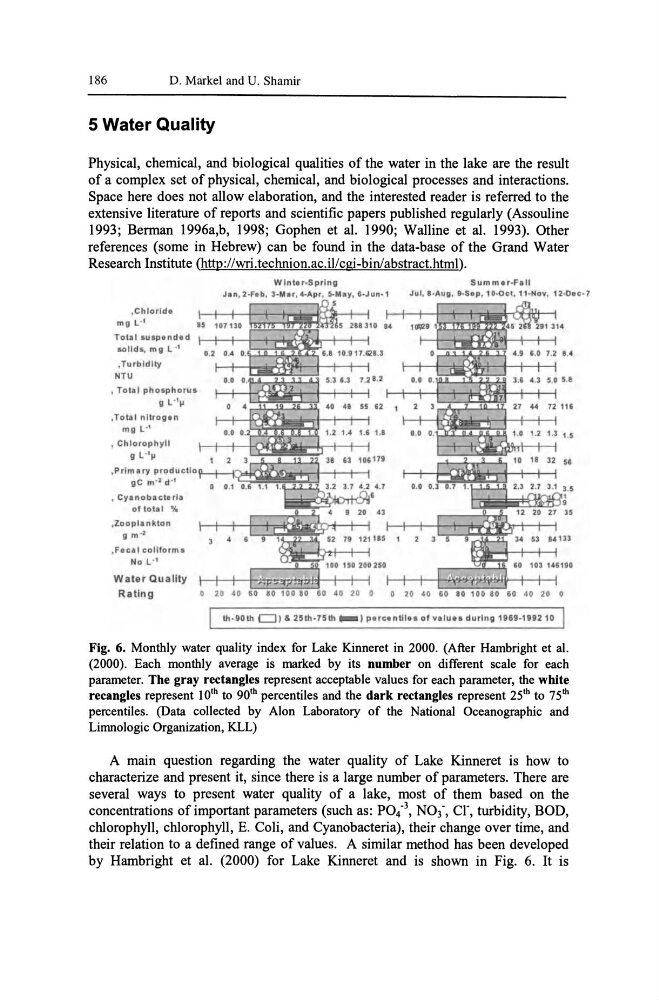
Fig. 6. Monthly water quality index for Lake Kinneret in 2000. (After Hambright et a1.
(2000). Each monthly average is marked by its number on different scale for each
parameter. The gray rectangles represent acceptable values for each parameter, the white
recangles represent loth to 90 th percentiles and the dark rectangles represent 25 th to 75 th
percentiles. (Data collected by Alon Laboratory of the National Oceanographic and
Limnologic Organization, KLL)
A main question regarding the water quality of Lake Kinneret is how to
characterize and present it, since there is a large number of parameters. There are
several ways to present water quality of a lake, most of them based on the
concentrations of important parameters (such as: P04· 3 , N03', cr, turbidity, BOD,
chlorophyll, chlorophyll, E. Coli, and Cyanobacteria), their change over time, and
their relation to a defined range of values. A similar method has been developed
by Hambright et al. (2000) for Lake Kinneret and is shown in Fig. 6. It is
D. Markel and U. Shamir
5 Water Quality
Physical, chemical, and biological qualities of the water in the lake are the result
of a complex set of physical, chemical, and biological processes and interactions.
Space here does not allow elaboration, and the interested reader is referred to the
extensive literature of reports and scientific papers published regularly (Assouline
1993; Berman 1996a,b, 1998; Gophen et al. 1990; Walline et al. 1993). Other
references (some in Hebrew) can be found in the data-base of the Grand Water
Research Institute (http://v.Ti.technion.ac.il/cgi-biniabstract.html).
,Chlorld.
mg l-1
Total suspended
solids, m g l - 1
,Turb idity
NTU
• Tot.al phosphorus
9 L " ~
,Total nitrogen
mg L"
· Chlorophyll
9 L"~
,Prim;ary productlo
gC m -1 d "
• Cyanobacullfl a
01 tolol %
,Zoopla n klon
g m-2
,Fecal eolltorms
No l · 1
Water Quality
Rating
••
0.2
1
n
0
Wlnter·Sprlng
J.n, 2·Feb. 3-M ~H . 4-Apr, s..Msy, 6-Jun-1
107130
N;'
0 .• O.
~,
0.0 O.
4
• • I~
0.0 O.
~
I1..l.
2 3
~
0.1 0 .6 1 .1 1 .~
, f) •
~
f'''·'
26831 o 8
6 ,810.917. Glll.l
' .3 • . 3 7.2 8.2
I I I
40 48
••
S2
1.2 1," I .• I .'
38 61 106 179
b~2 3.1 Jj~
,~
,
'.7
•
•
Summur-Fall
Jul, a-Aug , 9.Sep, 10-0el, 11-NDY, 1Z-Dac-7
~ .
1U1tl9 1
.~"'~ . .
,tV/ 1
8
0
4 .' 6.0 7 .2
'.'
0.0 O. ii'i"""'; ;-;--;; 3 .• ' .3 5 .• 5.8
:.D.
7
1
2
3
27 44 12 116
Nii
0.0 o.
1.0 1.2 1.3
~,'
1. '
.-.,
, 6 10 18 32
t--+:--:-~~Il;d~~~~' ~ 20 "t-::--:t:;~;i!:i~~..-+-+_2-i7 ,.
•
6
9 '~'8' I
2
3 •
.3 8413'
) :. 0 100 150200250 ,.----='--.... 60 103 U6190
"
I 'l,,~,",p~ti~ I I I
o 20 .0 60 80 10080 6 0 40 20 0 a 20 40 80 80 1 00 80 60 40 20 0
th·90lh 0) & 25th·75th . . ) percontll .. of •• lues during 1969·199210
Fig. 6. Monthly water quality index for Lake Kinneret in 2000. (After Hambright et a1.
(2000). Each monthly average is marked by its number on different scale for each
parameter. The gray rectangles represent acceptable values for each parameter, the white
recangles represent loth to 90 th percentiles and the dark rectangles represent 25 th to 75 th
percentiles. (Data collected by Alon Laboratory of the National Oceanographic and
Limnologic Organization, KLL)
A main question regarding the water quality of Lake Kinneret is how to
characterize and present it, since there is a large number of parameters. There are
several ways to present water quality of a lake, most of them based on the
concentrations of important parameters (such as: P04· 3 , N03', cr, turbidity, BOD,
chlorophyll, chlorophyll, E. Coli, and Cyanobacteria), their change over time, and
their relation to a defined range of values. A similar method has been developed
by Hambright et al. (2000) for Lake Kinneret and is shown in Fig. 6. It is