

Monitoring Lake Kinneret and its Watershed
185
Monitoring of heavy metals - Fe, Mn, AI, Cu, Cd, Pb, Cr, Mo, Zn, U, and a
few others.
Introduction of a new method for measuring the primary production by & 18 0
of the dissolved oxygen in the waterbody (Luz and Barkan 2000).
Measuring the concentration of the protozoa Giardia and Cryptosporidium in
the lake and some of the streams.
Quantifying the amount of phosphorus and nitrogen that is emitted from the
trout ranches in the north part of the watershed.
4 Water Quantities and Lake Levels
The history of lake levels since 1966 is shown in Fig. 2a. The normal range has
been between -208.9, which is the height of the outflow weir at Degania, and -
213, the "lower red line" until last year, creating a range of 4.1 m and an
operational volume of 680 mcm for an average annual inflow of 500+ mcm. The
"lower red line" used to be at -212 until a few years ago, and was lowered to
increase the operational volume and thus the average yield from the lake. Lake
levels are affected by both the inflows, which decreased in recent years, due to
increased withdrawals in the upper watershed and also to a drop in natural flows.
The trace of water levels in the lake throughout the last 6 years is shown in Fig.
2b. Lake levels have been dropping since the late 1980s, and in 1999 dropped
below -213. 2000 was a second dry year, and the level dropped further; 2001
began lower than any recent year of record.
"e
. .
Q
...
Year
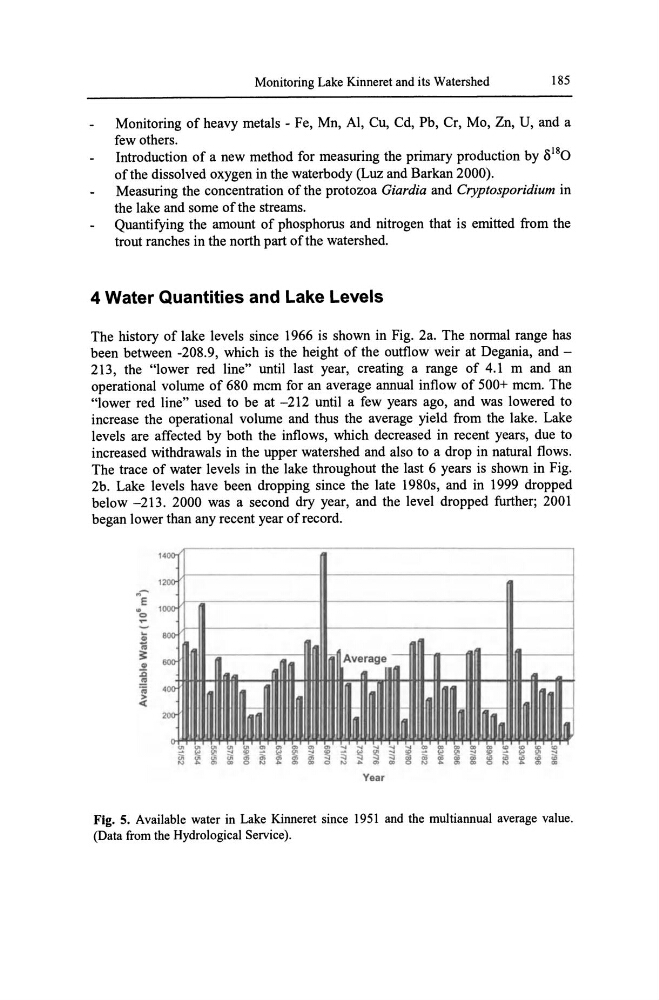
Fig. 5. Available water in Lake Kinneret since 1951 and the multiannual average value.
(Data from the Hydrological Service).
185
Monitoring of heavy metals - Fe, Mn, AI, Cu, Cd, Pb, Cr, Mo, Zn, U, and a
few others.
Introduction of a new method for measuring the primary production by & 18 0
of the dissolved oxygen in the waterbody (Luz and Barkan 2000).
Measuring the concentration of the protozoa Giardia and Cryptosporidium in
the lake and some of the streams.
Quantifying the amount of phosphorus and nitrogen that is emitted from the
trout ranches in the north part of the watershed.
4 Water Quantities and Lake Levels
The history of lake levels since 1966 is shown in Fig. 2a. The normal range has
been between -208.9, which is the height of the outflow weir at Degania, and -
213, the "lower red line" until last year, creating a range of 4.1 m and an
operational volume of 680 mcm for an average annual inflow of 500+ mcm. The
"lower red line" used to be at -212 until a few years ago, and was lowered to
increase the operational volume and thus the average yield from the lake. Lake
levels are affected by both the inflows, which decreased in recent years, due to
increased withdrawals in the upper watershed and also to a drop in natural flows.
The trace of water levels in the lake throughout the last 6 years is shown in Fig.
2b. Lake levels have been dropping since the late 1980s, and in 1999 dropped
below -213. 2000 was a second dry year, and the level dropped further; 2001
began lower than any recent year of record.
"e
. .
Q
...
Year
Fig. 5. Available water in Lake Kinneret since 1951 and the multiannual average value.
(Data from the Hydrological Service).