

Monitoring Lake Kinneret and its Watershed
183
An important question was raised regarding the optimal number and location
of the monitoring stations in Lake Kinneret. It was argued that measurements at
five stations do not adequately represent the whole lake volume. However,
significantly increasing the number of stations would lead to a decrease in the
sampling frequency, due to budget constraints. A recent analysis (Rom et al. 2000)
showed that decreasing the number of sampling locations from 33 to 17 (Mekorot
Company sampled, monthly 33 stations in the lake since 1990), while increasing
the sampling frequency from once a month to twice a month, would lead to an
increase in information of 30%. Another option for solving the spatial distribution
problem was the introduction of a Mini Bat, which is a towed vehicle carrying
instruments for spatial monitoring (A. Sukenik, this Vol). The Mini Bat carries a
set of electrodes and other measurement tools to measure conductivity,
temperature, and turbidity, and will be able to measure chlorophyll and particle
concentration in the future (A. Sukenik, this Vol.).
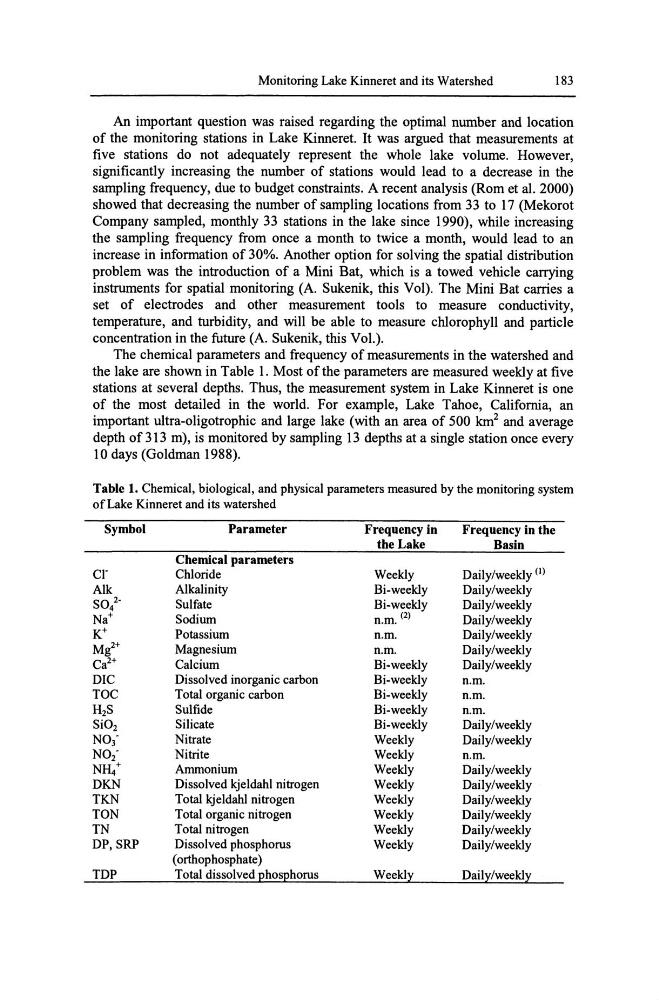
The chemical parameters and frequency of measurements in the watershed and
the lake are shown in Table 1. Most of the parameters are measured weekly at five
stations at several depths. Thus, the measurement system in Lake Kinneret is one
of the most detailed in the world. For example, Lake Tahoe, California, an
important ultra-oligotrophic and large lake (with an area of 500 km 2 and average
depth of 313 m), is monitored by sampling 13 depths at a single station once every
10 days (Goldman 1988).
Table 1. Chemical, biological, and physical parameters measured by the monitoring system
of Lake Kinneret and its watershed
Symbol
Parameter
Frequency in
Frequency in the
the Lake
Basin
Chemical parameters
cr
Chloride
Weekly
Daily/weekly (I)
Alk
Alkalinity
Bi-weekly
Daily/weekly
sot
Sulfate
Bi-weekly
Daily/weekly
Na+
Sodium
n.m. (2)
Daily/weekly
K+
Potassium
n.m.
Daily/weekly
Mi+
Magnesium
n.m.
Daily/weekly
Ca 2 +
Calcium
Bi-weekly
Daily/weekly
DIC
Dissolved inorganic carbon
Bi-weekly
n.m.
TOC
Total organic carbon
Bi-weekly
n.m.
H2S
Sulfide
Bi-weekly
n.m.
Si02
Silicate
Bi-weekly
Daily/weekly
N0 3 •
Nitrate
Weekly
Daily/weekly
N0 2 •
Nitrite
Weekly
n.m.
NH4+
Ammonium
Weekly
Daily/weekly
DKN
Dissolved kjeldahl nitrogen
Weekly
Daily/weekly
TKN
Total kjeldahl nitrogen
Weekly
Daily/weekly
TON
Total organic nitrogen
Weekly
Daily/weekly
TN
Total nitrogen
Weekly
Daily/weekly
DP, SRP
Dissolved phosphorus
Weekly
Daily/weekly
(orthophosphate)
TDP
Total dissolved EhosEhorus
Weekl~
Dail~/weekl~
183
An important question was raised regarding the optimal number and location
of the monitoring stations in Lake Kinneret. It was argued that measurements at
five stations do not adequately represent the whole lake volume. However,
significantly increasing the number of stations would lead to a decrease in the
sampling frequency, due to budget constraints. A recent analysis (Rom et al. 2000)
showed that decreasing the number of sampling locations from 33 to 17 (Mekorot
Company sampled, monthly 33 stations in the lake since 1990), while increasing
the sampling frequency from once a month to twice a month, would lead to an
increase in information of 30%. Another option for solving the spatial distribution
problem was the introduction of a Mini Bat, which is a towed vehicle carrying
instruments for spatial monitoring (A. Sukenik, this Vol). The Mini Bat carries a
set of electrodes and other measurement tools to measure conductivity,
temperature, and turbidity, and will be able to measure chlorophyll and particle
concentration in the future (A. Sukenik, this Vol.).
The chemical parameters and frequency of measurements in the watershed and
the lake are shown in Table 1. Most of the parameters are measured weekly at five
stations at several depths. Thus, the measurement system in Lake Kinneret is one
of the most detailed in the world. For example, Lake Tahoe, California, an
important ultra-oligotrophic and large lake (with an area of 500 km 2 and average
depth of 313 m), is monitored by sampling 13 depths at a single station once every
10 days (Goldman 1988).
Table 1. Chemical, biological, and physical parameters measured by the monitoring system
of Lake Kinneret and its watershed
Symbol
Parameter
Frequency in
Frequency in the
the Lake
Basin
Chemical parameters
cr
Chloride
Weekly
Daily/weekly (I)
Alk
Alkalinity
Bi-weekly
Daily/weekly
sot
Sulfate
Bi-weekly
Daily/weekly
Na+
Sodium
n.m. (2)
Daily/weekly
K+
Potassium
n.m.
Daily/weekly
Mi+
Magnesium
n.m.
Daily/weekly
Ca 2 +
Calcium
Bi-weekly
Daily/weekly
DIC
Dissolved inorganic carbon
Bi-weekly
n.m.
TOC
Total organic carbon
Bi-weekly
n.m.
H2S
Sulfide
Bi-weekly
n.m.
Si02
Silicate
Bi-weekly
Daily/weekly
N0 3 •
Nitrate
Weekly
Daily/weekly
N0 2 •
Nitrite
Weekly
n.m.
NH4+
Ammonium
Weekly
Daily/weekly
DKN
Dissolved kjeldahl nitrogen
Weekly
Daily/weekly
TKN
Total kjeldahl nitrogen
Weekly
Daily/weekly
TON
Total organic nitrogen
Weekly
Daily/weekly
TN
Total nitrogen
Weekly
Daily/weekly
DP, SRP
Dissolved phosphorus
Weekly
Daily/weekly
(orthophosphate)
TDP
Total dissolved EhosEhorus
Weekl~
Dail~/weekl~