

Water Quality Monitoring in Russian Rivers
121
highest discharge occurred regularly during the spring flood. The loads for the
different pollutants depended strongly On the discharge. Although the
concentrations generally decreased with increasing discharge (data not shown), the
pollutant loads increased with increasing discharge (see Table 7). This result
seems to contradict the finding that the pollutants have point sources. However, in
this context the increased discharges coming from the wastewater treatment plants
and tributaries, as well as the background concentrations and the surface runoffs
connected with flooding conditions, have to be considered. Increased amounts of
wastewater due to melting snow and rain not only increase the pollution load but
also reduce the efficiency of the water treatment, leading to a higher discharge of
pollutants. Nonpoint pollution sources, which under base flow conditions are less
important, may contribute during the flooding periods significantly to the pollutant
load of the rivers (Chernogaeva 1998). Also the background concentrations, which
are, for example, for the AOX in the range of 10 - 15 Ilgrl Cl (Gremm and
Frimmel 2000b) contribute under high flow conditions significantly to the total
pollution load. Since the calculation of pollutant loads is based On averaged
numbers, uncertainties of the given values have also to be considered. This is
especially the case for parameters that were determined in concentration ranges
close to the determination limit. Analytical errors may lead to additional
uncertainties in the calculations of the pollutant loads. The given loads for the
major pollutants have therefore to be discussed carefully. However, in order to
compare the pollution loads of the two rivers and to obtain an idea about the mass
of pollutant being transported by the two streams, the calculated loads are useful.
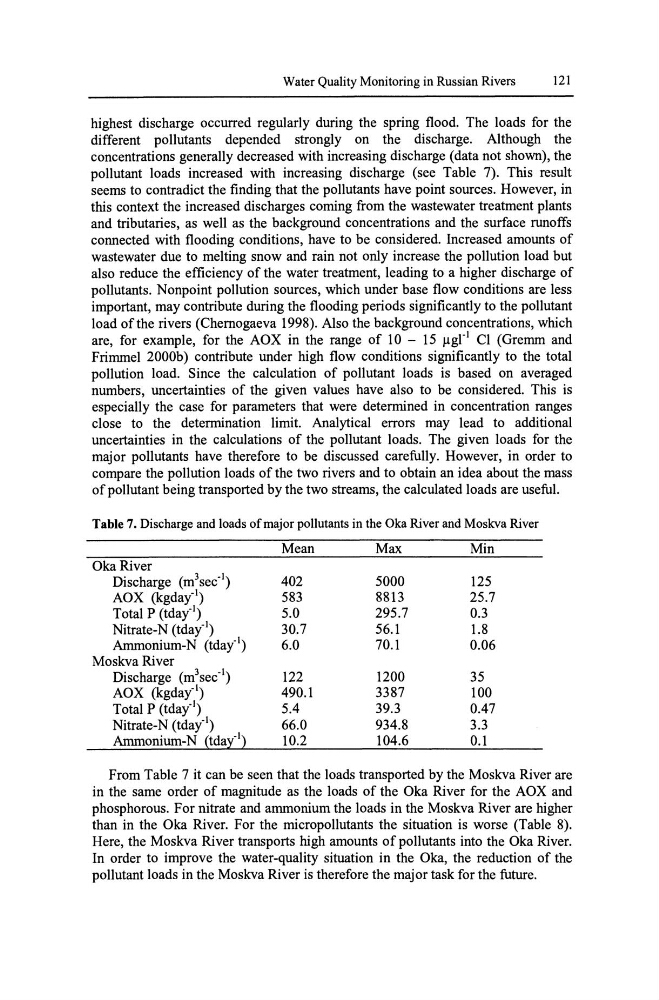
Table 7. Discharge and loads of major pollutants in the Oka River and Moskva River
Mean
Max
Min
OkaRiver
Discharge (m 3 sec· l )
402
5000
125
AOX (kgdail)
583
8813
25.7
Total P (tdail)
5.0
295.7
0.3
Nitrate-N (tdail)
30.7
56.1
1.8
Ammonium-N (tdail)
6.0
70.1
0.06
Moskva River
Discharge (m 3 sec· l )
122
1200
35
AOX (kgdail)
490.1
3387
100
Total P (tdail)
5.4
39.3
0.47
Nitrate-N (tdail)
66.0
934.8
3.3
Ammonium-N {tdatl}
10.2
104.6
0.1
From Table 7 it can be seen that the loads transported by the Moskva River are
in the same order of magnitude as the loads of the Oka River for the AOX and
phosphorous. For nitrate and ammonium the loads in the Moskva River are higher
than in the Oka River. For the micropollutants the situation is worse (Table 8).
Here, the Moskva River transports high amounts of pollutants into the Oka River.
In order to improve the water-quality situation in the Oka, the reduction of the
pollutant loads in the Moskva River is therefore the major task for the future.
121
highest discharge occurred regularly during the spring flood. The loads for the
different pollutants depended strongly On the discharge. Although the
concentrations generally decreased with increasing discharge (data not shown), the
pollutant loads increased with increasing discharge (see Table 7). This result
seems to contradict the finding that the pollutants have point sources. However, in
this context the increased discharges coming from the wastewater treatment plants
and tributaries, as well as the background concentrations and the surface runoffs
connected with flooding conditions, have to be considered. Increased amounts of
wastewater due to melting snow and rain not only increase the pollution load but
also reduce the efficiency of the water treatment, leading to a higher discharge of
pollutants. Nonpoint pollution sources, which under base flow conditions are less
important, may contribute during the flooding periods significantly to the pollutant
load of the rivers (Chernogaeva 1998). Also the background concentrations, which
are, for example, for the AOX in the range of 10 - 15 Ilgrl Cl (Gremm and
Frimmel 2000b) contribute under high flow conditions significantly to the total
pollution load. Since the calculation of pollutant loads is based On averaged
numbers, uncertainties of the given values have also to be considered. This is
especially the case for parameters that were determined in concentration ranges
close to the determination limit. Analytical errors may lead to additional
uncertainties in the calculations of the pollutant loads. The given loads for the
major pollutants have therefore to be discussed carefully. However, in order to
compare the pollution loads of the two rivers and to obtain an idea about the mass
of pollutant being transported by the two streams, the calculated loads are useful.
Table 7. Discharge and loads of major pollutants in the Oka River and Moskva River
Mean
Max
Min
OkaRiver
Discharge (m 3 sec· l )
402
5000
125
AOX (kgdail)
583
8813
25.7
Total P (tdail)
5.0
295.7
0.3
Nitrate-N (tdail)
30.7
56.1
1.8
Ammonium-N (tdail)
6.0
70.1
0.06
Moskva River
Discharge (m 3 sec· l )
122
1200
35
AOX (kgdail)
490.1
3387
100
Total P (tdail)
5.4
39.3
0.47
Nitrate-N (tdail)
66.0
934.8
3.3
Ammonium-N {tdatl}
10.2
104.6
0.1
From Table 7 it can be seen that the loads transported by the Moskva River are
in the same order of magnitude as the loads of the Oka River for the AOX and
phosphorous. For nitrate and ammonium the loads in the Moskva River are higher
than in the Oka River. For the micropollutants the situation is worse (Table 8).
Here, the Moskva River transports high amounts of pollutants into the Oka River.
In order to improve the water-quality situation in the Oka, the reduction of the
pollutant loads in the Moskva River is therefore the major task for the future.