

120
T. Gremm et a\.
The results indicate that nontreated and/or insufficiently treated municipal waste
water is the major source of the river water pollution in the studied area. The
major pollutants are coming into the Moskva River through tributaries. Especially
the Pechorka River (sample point 7, Fig. 2) could be identified as a major input of
pollutants into the Moskva River. This tributary receives the effluents of a
municipal waste water treatment station. The high AOX concentrations are most
likely caused by the formations of AOX substances during the chlorination of
waste water, which is a common wastewater treatment procedure in Russia
(Naidenko 2000, pers. commun.).
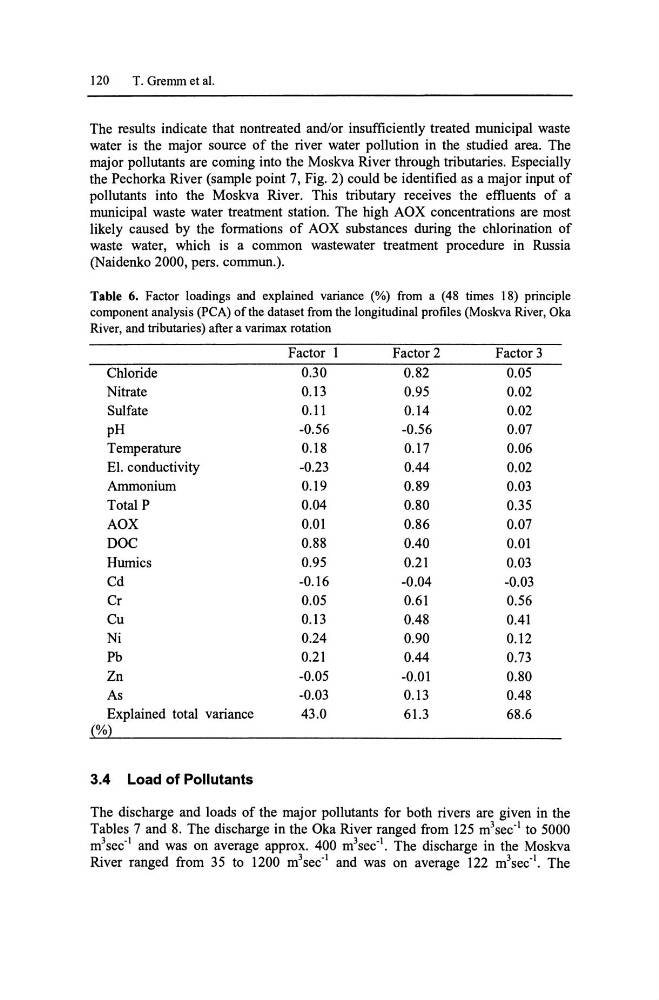
Table 6. Factor loadings and explained variance (%) from a (48 times 18) principle
component analysis (peA) of the dataset from the longitudinal profiles (Moskva River, Oka
River, and tributaries) after a varimax rotation
Factor 1
Factor 2
Factor 3
Chloride
0.30
0.82
0.05
Nitrate
0.13
0.95
0.02
Sulfate
0.11
0.14
0.02
pH
-0.56
-0.56
0.07
Temperature
0.18
0.17
0.06
El. conductivity
-0.23
0.44
0.02
Ammonium
0.19
0.89
0.Q3
Total P
0.04
0.80
0.35
AOX
0.01
0.86
0.07
DOC
0.88
0.40
0.01
Hurnics
0.95
0.21
0.03
Cd
-0.16
-0.04
-0.03
Cr
0.05
0.61
0.56
Cu
0.13
0.48
0.41
Ni
0.24
0.90
0.12
Pb
0.21
0.44
0.73
Zn
-0.05
-0.01
0.80
As
-0.03
0.13
0.48
Explained total variance
43.0
61.3
68.6
(%)
3.4 Load of Pollutants
The discharge and loads of the major pollutants for both rivers are given in the
Tables 7 and 8. The discharge in the Oka River ranged from 125 m 3 sec- 1 to 5000
m 3 sec- 1 and was on average approx. 400 m 3 sec- 1 • The discharge in the Moskva
River ranged from 35 to 1200 m 3 sec- 1 and was on average 122 m 3 sec- 1 • The
T. Gremm et a\.
The results indicate that nontreated and/or insufficiently treated municipal waste
water is the major source of the river water pollution in the studied area. The
major pollutants are coming into the Moskva River through tributaries. Especially
the Pechorka River (sample point 7, Fig. 2) could be identified as a major input of
pollutants into the Moskva River. This tributary receives the effluents of a
municipal waste water treatment station. The high AOX concentrations are most
likely caused by the formations of AOX substances during the chlorination of
waste water, which is a common wastewater treatment procedure in Russia
(Naidenko 2000, pers. commun.).
Table 6. Factor loadings and explained variance (%) from a (48 times 18) principle
component analysis (peA) of the dataset from the longitudinal profiles (Moskva River, Oka
River, and tributaries) after a varimax rotation
Factor 1
Factor 2
Factor 3
Chloride
0.30
0.82
0.05
Nitrate
0.13
0.95
0.02
Sulfate
0.11
0.14
0.02
pH
-0.56
-0.56
0.07
Temperature
0.18
0.17
0.06
El. conductivity
-0.23
0.44
0.02
Ammonium
0.19
0.89
0.Q3
Total P
0.04
0.80
0.35
AOX
0.01
0.86
0.07
DOC
0.88
0.40
0.01
Hurnics
0.95
0.21
0.03
Cd
-0.16
-0.04
-0.03
Cr
0.05
0.61
0.56
Cu
0.13
0.48
0.41
Ni
0.24
0.90
0.12
Pb
0.21
0.44
0.73
Zn
-0.05
-0.01
0.80
As
-0.03
0.13
0.48
Explained total variance
43.0
61.3
68.6
(%)
3.4 Load of Pollutants
The discharge and loads of the major pollutants for both rivers are given in the
Tables 7 and 8. The discharge in the Oka River ranged from 125 m 3 sec- 1 to 5000
m 3 sec- 1 and was on average approx. 400 m 3 sec- 1 • The discharge in the Moskva
River ranged from 35 to 1200 m 3 sec- 1 and was on average 122 m 3 sec- 1 • The