

Water Quality Monitoring in Russian Rivers
113
concentrations of chlorinated organic pollutants were found. This result supports
the outcome of the screening analysis in the water samples. As discussed by
Gremm and Frimmel (2000b) the major portion of the AOX in the Moskva River
is coming from anthropogenic sources. An important source for the AOX are
chlorination processes of organic material during disinfection of wastewater.
Chlorinated compounds from direct inputs into the aquatic system and their
degradation products might be another source of the AOX. Further studies will
hopefully reveal more detailed information on this topic.
Table 4. Typical concentration ranges ofPAH in the Oka River (sampling point A) and the
Moskva River (sampling point E)
PAR
Naphthaline
Fluorene
Phenanthrene
Anthracene
Fluoranthene
Pyrene
nd = not detectable
Cu
NI
Fluoranthene
Nitrate
Tot.I·P
Ammonia
AOX
CHCI ,
~r
~
;J;;'
h
LI
r--- ~
~
o
200
Oka
(flgr ' )
nd- 0.05
nd -1.1
2.6-0,8
nd- 0.04
nd-1.9
nd - 2.1
I
i I
:.
-I
400
600
. ~
800
Moskva
(flgr ' )
0.01 - 2.4
0.04- 2.1
0.02 -11.3
nd-2.2
0.04 - 2.0
0.1-2.6
D Oka A
• Moskva E
D Oka C
-,
~I
1000
1200
Percenta". of quality tar".t
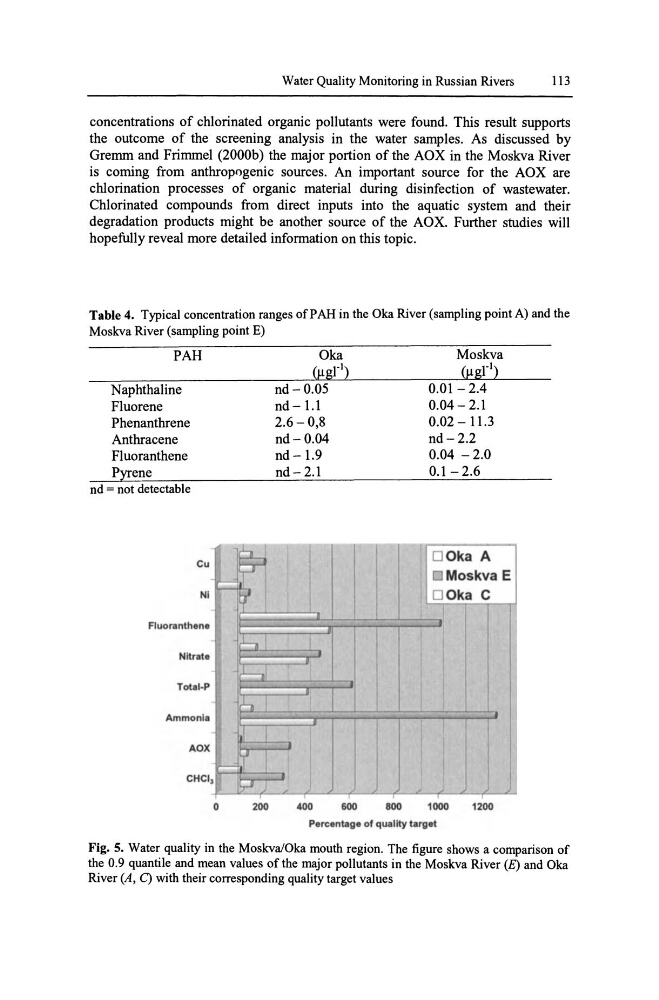
Fig. 5. Water quality in the Moskva/Oka mouth region. The figure shows a comparison of
the 0.9 quantile and mean values of the major pollutants in the Moskva River (E) and Oka
River (A, C) with their corresponding quality target values
113
concentrations of chlorinated organic pollutants were found. This result supports
the outcome of the screening analysis in the water samples. As discussed by
Gremm and Frimmel (2000b) the major portion of the AOX in the Moskva River
is coming from anthropogenic sources. An important source for the AOX are
chlorination processes of organic material during disinfection of wastewater.
Chlorinated compounds from direct inputs into the aquatic system and their
degradation products might be another source of the AOX. Further studies will
hopefully reveal more detailed information on this topic.
Table 4. Typical concentration ranges ofPAH in the Oka River (sampling point A) and the
Moskva River (sampling point E)
PAR
Naphthaline
Fluorene
Phenanthrene
Anthracene
Fluoranthene
Pyrene
nd = not detectable
Cu
NI
Fluoranthene
Nitrate
Tot.I·P
Ammonia
AOX
CHCI ,
~r
~
;J;;'
h
LI
r--- ~
~
o
200
Oka
(flgr ' )
nd- 0.05
nd -1.1
2.6-0,8
nd- 0.04
nd-1.9
nd - 2.1
I
i I
:.
-I
400
600
. ~
800
Moskva
(flgr ' )
0.01 - 2.4
0.04- 2.1
0.02 -11.3
nd-2.2
0.04 - 2.0
0.1-2.6
D Oka A
• Moskva E
D Oka C
-,
~I
1000
1200
Percenta". of quality tar".t
Fig. 5. Water quality in the Moskva/Oka mouth region. The figure shows a comparison of
the 0.9 quantile and mean values of the major pollutants in the Moskva River (E) and Oka
River (A, C) with their corresponding quality target values