

Water Quality Monitoring in Russian Rivers
111
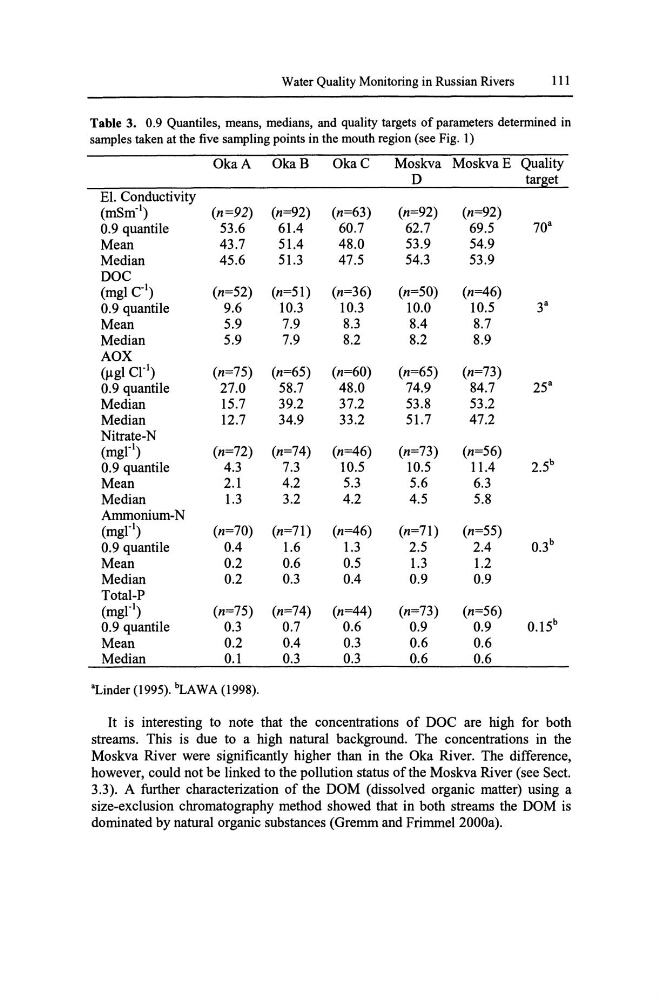
Table 3. 0.9 Quantiles, means, medians, and quality targets of parameters determined in
samples taken at the five sampling points in the mouth region (see Fig. 1)
OkaA
OkaB
OkaC
Moskva MoskvaE Quality
D
target
El. Conductivity
(mSm- 1 )
(n=92) (n=92)
(n=63)
(n=92)
(n=92)
0.9 quantile
53.6
61.4
60.7
62.7
69.5
70"
Mean
43.7
51.4
48.0
53.9
54.9
Median
45.6
51.3
47.5
54.3
53.9
DOC
(mgl C- 1 )
(n=52) (n=51)
(n=36)
(n=50)
(n=46)
0.9 quantile
9.6
10.3
10.3
10.0
10.5
3"
Mean
5.9
7.9
8.3
8.4
8.7
Median
5.9
7.9
8.2
8.2
8.9
AOX
()lgl Crl)
(n=75) (n=65)
(n=60)
(n=65)
(n=73)
0.9 quantile
27.0
58.7
48.0
74.9
84.7
25"
Median
15.7
39.2
37.2
53.8
53.2
Median
12.7
34.9
33.2
51.7
47.2
Nitrate-N
(mgrl)
(n=72) (n=74)
(n=46)
(n=73)
(n=56)
0.9 quantile
4.3
7.3
10.5
10.5
11.4
2.5 b
Mean
2.1
4.2
5.3
5.6
6.3
Median
1.3
3.2
4.2
4.5
5.8
Ammonium-N
(mgrl)
(n=70) (n=71)
(n=46)
(n=71)
(n=55)
0.9 quantile
0.4
1.6
1.3
2.5
2.4
O.3 b
Mean
0.2
0.6
0.5
1.3
1.2
Median
0.2
0.3
0.4
0.9
0.9
Total-P
(mgrl)
(n=75) (n=74)
(n=44)
(n=73)
(n=56)
0.9 quantile
0.3
0.7
0.6
0.9
0.9
0.15 b
Mean
0.2
0.4
0.3
0.6
0.6
Median
0.1
0.3
0.3
0.6
0.6
"Linder (1995). bLA W A (1998).
It is interesting to note that the concentrations of DOC are high for both
streams. This is due to a high natural background. The concentrations in the
Moskva River were significantly higher than in the Oka River. The difference,
however, could not be linked to the pollution status of the Moskva River (see Sect.
3.3). A further characterization of the DOM (dissolved organic matter) using a
size-exclusion chromatography method showed that in both streams the DOM is
dominated by natural organic substances (Gremrn and Frimrnel 2000a).
111
Table 3. 0.9 Quantiles, means, medians, and quality targets of parameters determined in
samples taken at the five sampling points in the mouth region (see Fig. 1)
OkaA
OkaB
OkaC
Moskva MoskvaE Quality
D
target
El. Conductivity
(mSm- 1 )
(n=92) (n=92)
(n=63)
(n=92)
(n=92)
0.9 quantile
53.6
61.4
60.7
62.7
69.5
70"
Mean
43.7
51.4
48.0
53.9
54.9
Median
45.6
51.3
47.5
54.3
53.9
DOC
(mgl C- 1 )
(n=52) (n=51)
(n=36)
(n=50)
(n=46)
0.9 quantile
9.6
10.3
10.3
10.0
10.5
3"
Mean
5.9
7.9
8.3
8.4
8.7
Median
5.9
7.9
8.2
8.2
8.9
AOX
()lgl Crl)
(n=75) (n=65)
(n=60)
(n=65)
(n=73)
0.9 quantile
27.0
58.7
48.0
74.9
84.7
25"
Median
15.7
39.2
37.2
53.8
53.2
Median
12.7
34.9
33.2
51.7
47.2
Nitrate-N
(mgrl)
(n=72) (n=74)
(n=46)
(n=73)
(n=56)
0.9 quantile
4.3
7.3
10.5
10.5
11.4
2.5 b
Mean
2.1
4.2
5.3
5.6
6.3
Median
1.3
3.2
4.2
4.5
5.8
Ammonium-N
(mgrl)
(n=70) (n=71)
(n=46)
(n=71)
(n=55)
0.9 quantile
0.4
1.6
1.3
2.5
2.4
O.3 b
Mean
0.2
0.6
0.5
1.3
1.2
Median
0.2
0.3
0.4
0.9
0.9
Total-P
(mgrl)
(n=75) (n=74)
(n=44)
(n=73)
(n=56)
0.9 quantile
0.3
0.7
0.6
0.9
0.9
0.15 b
Mean
0.2
0.4
0.3
0.6
0.6
Median
0.1
0.3
0.3
0.6
0.6
"Linder (1995). bLA W A (1998).
It is interesting to note that the concentrations of DOC are high for both
streams. This is due to a high natural background. The concentrations in the
Moskva River were significantly higher than in the Oka River. The difference,
however, could not be linked to the pollution status of the Moskva River (see Sect.
3.3). A further characterization of the DOM (dissolved organic matter) using a
size-exclusion chromatography method showed that in both streams the DOM is
dominated by natural organic substances (Gremrn and Frimrnel 2000a).