

110
T. Gremm et al.
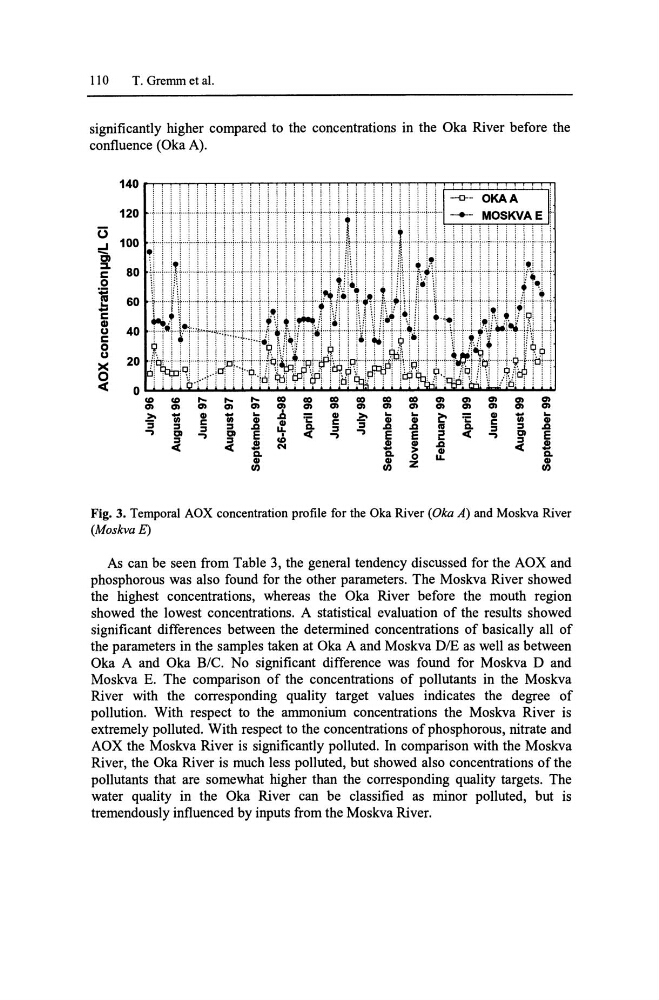
significantly higher compared to the concentrations in the Oka River before the
confluence (Oka A).
0 '" '"
.... .... .... co co co co co co
'" '" '" '" '"
'" '" '" '" '" ~ '" '" '" '" '" '" '" '" '" '"
b
-
GI
"Tii
. . ;: GI b .. . . ~ =E
GI
"Ti i
..
III
C
GI
GI
C
GI
GI
C
GI
:::I
:::I
:::I
:::I
.c LL
Q.
:::I
:::I
.c .c
I'll
Q.
:::I
:::I
.c
.., CI .., CI E cb
:::I
:::I
N
t ~ .c
GI
0
LL
Q.
GI
GI
Z
GI
I/)
I/)
I/)
Fig. 3. Temporal AOX concentration profile for the Oka River (Oka A) and Moskva River
(Moskva£)
As can be seen from Table 3, the general tendency discussed for the AOX and
phosphorous was also found for the other parameters. The Moskva River showed
the highest concentrations, whereas the Oka River before the mouth region
showed the lowest concentrations. A statistical evaluation of the results showed
significant differences between the determined concentrations of basically all of
the parameters in the samples taken at Oka A and Moskva DIE as well as between
Oka A and Oka H/C. No significant difference was found for Moskva D and
Moskva E. The comparison of the concentrations of pollutants in the Moskva
River with the corresponding quality target values indicates the degree of
pollution. With respect to the ammonium concentrations the Moskva River is
extremely polluted. With respect to the concentrations of phosphorous, nitrate and
AOX the Moskva River is significantly polluted. In comparison with the Moskva
River, the Oka River is much less polluted, but showed also concentrations of the
pollutants that are somewhat higher than the corresponding quality targets. The
water quality in the Oka River can be classified as minor polluted, but is
tremendously influenced by inputs from the Moskva River.
T. Gremm et al.
significantly higher compared to the concentrations in the Oka River before the
confluence (Oka A).
0 '" '"
.... .... .... co co co co co co
'" '" '" '" '"
'" '" '" '" '" ~ '" '" '" '" '" '" '" '" '" '"
b
-
GI
"Tii
. . ;: GI b .. . . ~ =E
GI
"Ti i
..
III
C
GI
GI
C
GI
GI
C
GI
:::I
:::I
:::I
:::I
.c LL
Q.
:::I
:::I
.c .c
I'll
Q.
:::I
:::I
.c
.., CI .., CI E cb
:::I
:::I
N
t ~ .c
GI
0
LL
Q.
GI
GI
Z
GI
I/)
I/)
I/)
Fig. 3. Temporal AOX concentration profile for the Oka River (Oka A) and Moskva River
(Moskva£)
As can be seen from Table 3, the general tendency discussed for the AOX and
phosphorous was also found for the other parameters. The Moskva River showed
the highest concentrations, whereas the Oka River before the mouth region
showed the lowest concentrations. A statistical evaluation of the results showed
significant differences between the determined concentrations of basically all of
the parameters in the samples taken at Oka A and Moskva DIE as well as between
Oka A and Oka H/C. No significant difference was found for Moskva D and
Moskva E. The comparison of the concentrations of pollutants in the Moskva
River with the corresponding quality target values indicates the degree of
pollution. With respect to the ammonium concentrations the Moskva River is
extremely polluted. With respect to the concentrations of phosphorous, nitrate and
AOX the Moskva River is significantly polluted. In comparison with the Moskva
River, the Oka River is much less polluted, but showed also concentrations of the
pollutants that are somewhat higher than the corresponding quality targets. The
water quality in the Oka River can be classified as minor polluted, but is
tremendously influenced by inputs from the Moskva River.