

Water Quality Monitoring in Russian Rivers
109
3 Results and Discussion
Overall, 95 sampling series were carried out in the studied area and approx.
10 000 parameter values were determined from the samples. Not all of the basic
parameters could be determined on a regular basis in the laboratory in Kolornna
because of problems with the supply of materials and equipment. This was
especially the case in the beginning of the project. However, gaps in the dataset
could be backed up with results of the monthly mixed samples analyzed in the
laboratory in Karlsruhe. The obtained dataset allows the evaluation of the water
quality in the two rivers in terms of the general status and with respect to the
spatial and temporal variations.
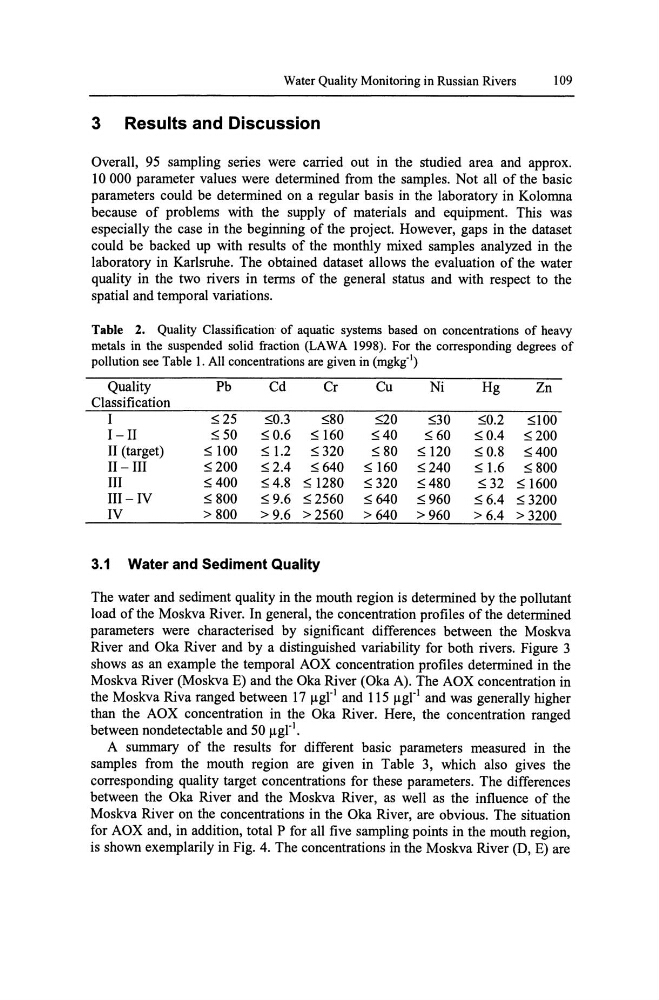
Table 2. Quality Classification of aquatic systems based on concentrations of heavy
metals in the suspended solid fraction (LA WA 1998). For the corresponding degrees of
pollution see Table 1. All concentrations are given in (mgkg"l)
Quality
Pb
Cd
Cr
Cu
Ni
Hg
Zn
Classification
I
:5 25
:50.3
:580
:520
:530
:50.2
:5100
I - II
:5 50
:5 0.6 :5 160
:5 40
:5 60
:50.4 :5 200
II (target)
:5 100
:5 1.2 :5 320
:5 80 :5 120
:50.8 :5 400
II - III
:5 200
:52.4 :5 640 :5 160 :5 240
:5 1.6 :5 800
III
:5 400
:54.8 :5 1280 :5 320 :5 480
:5 32 :5 1600
III - IV
:5 800
:59.6 :5 2560
:5 640 :5 960
:56.4 :5 3200
IV
> 800
> 9.6 >2560
>640 >960
>6.4 >3200
3.1 Water and Sediment Quality
The water and sediment quality in the mouth region is determined by the pollutant
load of the Moskva River. In general, the concentration profiles of the determined
parameters were characterised by significant differences between the Moskva
River and Oka River and by a distinguished variability for both rivers. Figure 3
shows as an example the temporal AOX concentration profiles determined in the
Moskva River (Moskva E) and the Oka River (Oka A). The AOX concentration in
the Moskva Riva ranged between 17 flgr1 and 115 flgr1 and was generally higher
than the AOX concentration in the Oka River. Here, the concentration ranged
between nondetectable and 50 flgr1.
A summary of the results for different basic parameters measured in the
samples from the mouth region are given in Table 3, which also gives the
corresponding quality target concentrations for these parameters. The differences
between the Oka River and the Moskva River, as well as the influence of the
Moskva River on the concentrations in the Oka River, are obvious. The situation
for AOX and, in addition, total P for all five sampling points in the mouth region,
is shown exemplarily in Fig. 4. The concentrations in the Moskva River (D, E) are
109
3 Results and Discussion
Overall, 95 sampling series were carried out in the studied area and approx.
10 000 parameter values were determined from the samples. Not all of the basic
parameters could be determined on a regular basis in the laboratory in Kolornna
because of problems with the supply of materials and equipment. This was
especially the case in the beginning of the project. However, gaps in the dataset
could be backed up with results of the monthly mixed samples analyzed in the
laboratory in Karlsruhe. The obtained dataset allows the evaluation of the water
quality in the two rivers in terms of the general status and with respect to the
spatial and temporal variations.
Table 2. Quality Classification of aquatic systems based on concentrations of heavy
metals in the suspended solid fraction (LA WA 1998). For the corresponding degrees of
pollution see Table 1. All concentrations are given in (mgkg"l)
Quality
Pb
Cd
Cr
Cu
Ni
Hg
Zn
Classification
I
:5 25
:50.3
:580
:520
:530
:50.2
:5100
I - II
:5 50
:5 0.6 :5 160
:5 40
:5 60
:50.4 :5 200
II (target)
:5 100
:5 1.2 :5 320
:5 80 :5 120
:50.8 :5 400
II - III
:5 200
:52.4 :5 640 :5 160 :5 240
:5 1.6 :5 800
III
:5 400
:54.8 :5 1280 :5 320 :5 480
:5 32 :5 1600
III - IV
:5 800
:59.6 :5 2560
:5 640 :5 960
:56.4 :5 3200
IV
> 800
> 9.6 >2560
>640 >960
>6.4 >3200
3.1 Water and Sediment Quality
The water and sediment quality in the mouth region is determined by the pollutant
load of the Moskva River. In general, the concentration profiles of the determined
parameters were characterised by significant differences between the Moskva
River and Oka River and by a distinguished variability for both rivers. Figure 3
shows as an example the temporal AOX concentration profiles determined in the
Moskva River (Moskva E) and the Oka River (Oka A). The AOX concentration in
the Moskva Riva ranged between 17 flgr1 and 115 flgr1 and was generally higher
than the AOX concentration in the Oka River. Here, the concentration ranged
between nondetectable and 50 flgr1.
A summary of the results for different basic parameters measured in the
samples from the mouth region are given in Table 3, which also gives the
corresponding quality target concentrations for these parameters. The differences
between the Oka River and the Moskva River, as well as the influence of the
Moskva River on the concentrations in the Oka River, are obvious. The situation
for AOX and, in addition, total P for all five sampling points in the mouth region,
is shown exemplarily in Fig. 4. The concentrations in the Moskva River (D, E) are