

108
T. Gremm et aJ.
PCA and CA the variables were standardized by nonnalization to the
corresponding standard deviation.
2.3 Water-Quality Targets
The quality classification in the Oka River and Moskva River was done by
comparison of the measured data with quality targets for water, suspended solids,
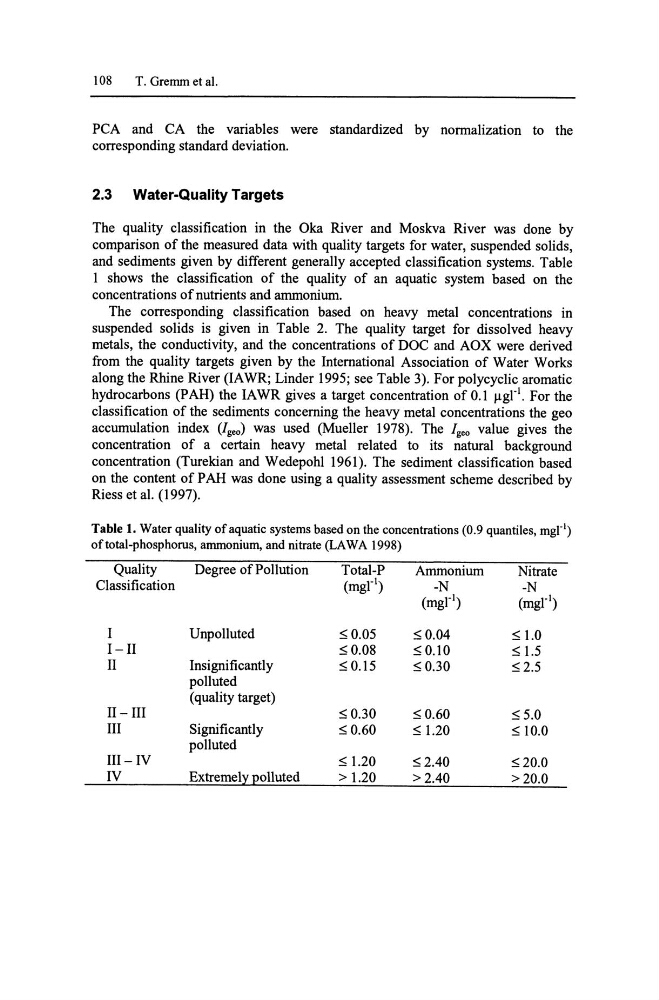
and sediments given by different generally accepted classification systems. Table
1 shows the classification of the quality of an aquatic system based on the
concentrations of nutrients and ammonium.
The corresponding classification based on heavy metal concentrations in
suspended solids is given in Table 2. The quality target for dissolved heavy
metals, the conductivity, and the concentrations of DOC and AOX were derived
from the quality targets given by the International Association of Water Works
along the Rhine River (IA WR; Linder 1995; see Table 3). For polycyclic aromatic
hydrocarbons (PAH) the IAWR gives a target concentration of 0.1 J.lgr l . For the
classification of the sediments concerning the heavy metal concentrations the geo
accumulation index (/geo) was used (Mueller 1978). The Igeo value gives the
concentration of a certain heavy metal related to its natural background
concentration (Turekian and Wedepohl 1961). The sediment classification based
on the content of P AH was done using a quality assessment scheme described by
Riess et at. (1997).
Table 1. Water quality of aquatic systems based on the concentrations (0.9 quantiles, mgl· 1 )
of total-phosphorus, ammonium, and nitrate (LAW A 1998)
Quality
Degree of Pollution
Total-P
Ammonium
Nitrate
Classification
(mgrl)
-N
-N
(mgr l )
(mgr l )
I
Unpolluted
50.05
50.04
51.0
I-II
50.08
50.10
51.5
II
Insignificantly
50.15
50.30
52.5
polluted
(quality target)
II - III
50.30
50.60
55.0
III
Significantly
50.60
51.20
510.0
polluted
III- IV
51.20
52.40
520.0
IV
Extremelx Eolluted
>1.20
>2.40
>20.0
T. Gremm et aJ.
PCA and CA the variables were standardized by nonnalization to the
corresponding standard deviation.
2.3 Water-Quality Targets
The quality classification in the Oka River and Moskva River was done by
comparison of the measured data with quality targets for water, suspended solids,
and sediments given by different generally accepted classification systems. Table
1 shows the classification of the quality of an aquatic system based on the
concentrations of nutrients and ammonium.
The corresponding classification based on heavy metal concentrations in
suspended solids is given in Table 2. The quality target for dissolved heavy
metals, the conductivity, and the concentrations of DOC and AOX were derived
from the quality targets given by the International Association of Water Works
along the Rhine River (IA WR; Linder 1995; see Table 3). For polycyclic aromatic
hydrocarbons (PAH) the IAWR gives a target concentration of 0.1 J.lgr l . For the
classification of the sediments concerning the heavy metal concentrations the geo
accumulation index (/geo) was used (Mueller 1978). The Igeo value gives the
concentration of a certain heavy metal related to its natural background
concentration (Turekian and Wedepohl 1961). The sediment classification based
on the content of P AH was done using a quality assessment scheme described by
Riess et at. (1997).
Table 1. Water quality of aquatic systems based on the concentrations (0.9 quantiles, mgl· 1 )
of total-phosphorus, ammonium, and nitrate (LAW A 1998)
Quality
Degree of Pollution
Total-P
Ammonium
Nitrate
Classification
(mgrl)
-N
-N
(mgr l )
(mgr l )
I
Unpolluted
50.05
50.04
51.0
I-II
50.08
50.10
51.5
II
Insignificantly
50.15
50.30
52.5
polluted
(quality target)
II - III
50.30
50.60
55.0
III
Significantly
50.60
51.20
510.0
polluted
III- IV
51.20
52.40
520.0
IV
Extremelx Eolluted
>1.20
>2.40
>20.0