

Metals
39
Table 2.21
Recovery of major constituents from all samples relative to total amount present (all
values in %)
mg kg- 1 method under test x 100
= mg kg- I nitric acid dry ashing;
(see Table 2.19) (from [38])
pH 3
pH7
citrateHydroxylamine
Ashing 0.3 moll- 1 HCl
dithionite
dithionite
acetic acid
Si0 2 X (mean)
1.5
0.89
0.27
0.32
R (range)
0.13- 5.14
0.11- 2.23
0.03-0.73
0.01-0.93
~ (std deY)
0.50
0.24
0.09
0.12
Ai
X
30.9
10.0
8.2
2.7
3.0
R
6.2-49.0 2.1-18.1
1.0-20.3
0.2-10.1
0.1-12.6
(1
4.5
1.7
1.9
1.0
1.2
Fe
X
71.5
35.8
50.9
18.0
9.3
R
29.6-97.7 13.1-71.9
16.4-85.9
4.1-40.5
2.6-20.6
(1
7.8
6.4
7.3
3.6
2.1
Mn
X
62.0
73.2
68.1
36.3
49.8
R
27.7-88.6 32.9-106
16.8-112
7.4-82.6
11.4-103
(1
7.1
9.7
10.9
10.8
9.3
a Si0 2 is not brought back into solution following dry ashing of samples. No data are therefore
available on Si0 2 concentration extracted
Table 2.22
Mean recovery of metals from all samples relative to ashing procedure (all values in %)
mg kg- 1 method under test x 100
= mg kg- I nitric acid dry ashing;
(see Table 2.20) (from [38])
pH3
pH 7
citrateHydroxylamine
0.3 moll- 1 HCl
dithionite
dithionite
acetic acid
Ai
34.1 ± 4.2
26.7 ± 5.2
8.8 ± 3.1
10.2 ± 4.0
Fe
50.0 ± 7.3
73.2 ± 8.9
26.0 ± 4.4
14.7 ± 4.5
Mn
117 ± 20.3
96.7 ± 15.9
51.7 ± 15.1
69.9 ± 14.0
Cu
93.0 ± 13.8
73.4 ± 9.7
3.2 ± 1.1
52.8 ± 10.5
Ni
60.1 ± 5.1
71.1 ± 11.9
23.2 ± 5.2
32.0 ± 9.5
Pb
48.9 ± 7.3
85.2 ± 4.5
23.5 ± 3.1
36.2 ± 6.1
Zn
75.9 ± 6.1
62.4 ± 6.7
34.3 ± 10.1
37.8 ± 7.8
Cd
110 ± 12.6
146 ± 22.0
70.9 ± 13.7
80.8 ± 15.6
Cr
59.8 ± 5.8
80.1 ± 11.3
46.5 ± 6.6
30.6 ± 6.9
Co
81.4 ± 5.9
104 ± 14.2
39.0 ± 3.9
47.2 ± 5.6
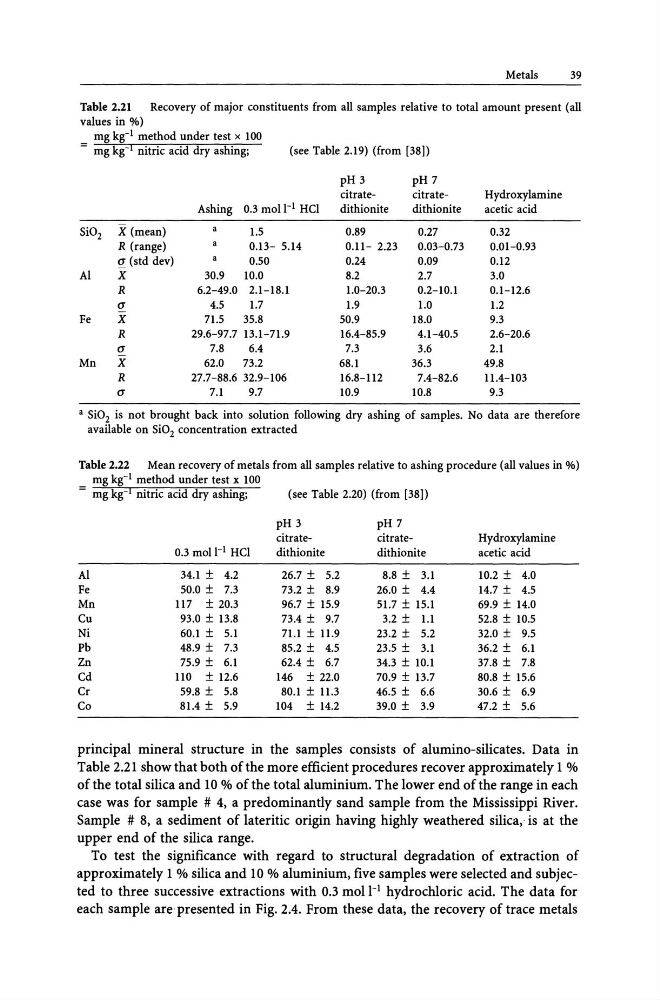
principal mineral structure in the samples consists of alumino-silicates. Data in
Table 2.21 show that both of the more efficient procedures recover approximately 1 %
of the total silica and 10 % of the total aluminium. The lower end of the range in each
case was for sample # 4, a predominantly sand sample from the Mississippi River.
Sample # 8, a sediment of lateritic origin having highly weathered silica,. is at the
upper end of the silica range.
To test the significance with regard to structural degradation of extraction of
approximately 1 % silica and 10 % aluminium, five samples were selected and subjected to three successive extractions with 0.3 mol 1-1 hydrochloric acid. The data for
each sample are presented in Fig. 2.4. From these data, the recovery of trace metals
39
Table 2.21
Recovery of major constituents from all samples relative to total amount present (all
values in %)
mg kg- 1 method under test x 100
= mg kg- I nitric acid dry ashing;
(see Table 2.19) (from [38])
pH 3
pH7
citrateHydroxylamine
Ashing 0.3 moll- 1 HCl
dithionite
dithionite
acetic acid
Si0 2 X (mean)
1.5
0.89
0.27
0.32
R (range)
0.13- 5.14
0.11- 2.23
0.03-0.73
0.01-0.93
~ (std deY)
0.50
0.24
0.09
0.12
Ai
X
30.9
10.0
8.2
2.7
3.0
R
6.2-49.0 2.1-18.1
1.0-20.3
0.2-10.1
0.1-12.6
(1
4.5
1.7
1.9
1.0
1.2
Fe
X
71.5
35.8
50.9
18.0
9.3
R
29.6-97.7 13.1-71.9
16.4-85.9
4.1-40.5
2.6-20.6
(1
7.8
6.4
7.3
3.6
2.1
Mn
X
62.0
73.2
68.1
36.3
49.8
R
27.7-88.6 32.9-106
16.8-112
7.4-82.6
11.4-103
(1
7.1
9.7
10.9
10.8
9.3
a Si0 2 is not brought back into solution following dry ashing of samples. No data are therefore
available on Si0 2 concentration extracted
Table 2.22
Mean recovery of metals from all samples relative to ashing procedure (all values in %)
mg kg- 1 method under test x 100
= mg kg- I nitric acid dry ashing;
(see Table 2.20) (from [38])
pH3
pH 7
citrateHydroxylamine
0.3 moll- 1 HCl
dithionite
dithionite
acetic acid
Ai
34.1 ± 4.2
26.7 ± 5.2
8.8 ± 3.1
10.2 ± 4.0
Fe
50.0 ± 7.3
73.2 ± 8.9
26.0 ± 4.4
14.7 ± 4.5
Mn
117 ± 20.3
96.7 ± 15.9
51.7 ± 15.1
69.9 ± 14.0
Cu
93.0 ± 13.8
73.4 ± 9.7
3.2 ± 1.1
52.8 ± 10.5
Ni
60.1 ± 5.1
71.1 ± 11.9
23.2 ± 5.2
32.0 ± 9.5
Pb
48.9 ± 7.3
85.2 ± 4.5
23.5 ± 3.1
36.2 ± 6.1
Zn
75.9 ± 6.1
62.4 ± 6.7
34.3 ± 10.1
37.8 ± 7.8
Cd
110 ± 12.6
146 ± 22.0
70.9 ± 13.7
80.8 ± 15.6
Cr
59.8 ± 5.8
80.1 ± 11.3
46.5 ± 6.6
30.6 ± 6.9
Co
81.4 ± 5.9
104 ± 14.2
39.0 ± 3.9
47.2 ± 5.6
principal mineral structure in the samples consists of alumino-silicates. Data in
Table 2.21 show that both of the more efficient procedures recover approximately 1 %
of the total silica and 10 % of the total aluminium. The lower end of the range in each
case was for sample # 4, a predominantly sand sample from the Mississippi River.
Sample # 8, a sediment of lateritic origin having highly weathered silica,. is at the
upper end of the silica range.
To test the significance with regard to structural degradation of extraction of
approximately 1 % silica and 10 % aluminium, five samples were selected and subjected to three successive extractions with 0.3 mol 1-1 hydrochloric acid. The data for
each sample are presented in Fig. 2.4. From these data, the recovery of trace metals