

38
River and Stream Sediments
Table 2.20
Mean concentraDetermination
Method
Sample
tion of minor constituents (all
1
2
concentrations in mg kg-I)
Cu
(b)
1.62
169
(from [38])
(c)
0.67
172
(d)
0.87
159
(e)
0.12
4.77
(f)
0.11
126
Ni
(b)
7.07
238
(c)
5.83
67.6
(d)
5.69
III
(e)
1.06
35.5
(f)
1.18
25.5
Pb
(b)
50.9
91.9
(c)
5.64
28.4
(d)
20.3
45.4
(e)
8.82
23.6
(f)
2.49
17.7
Zn
(b)
12.9
123
(c)
7.03
73.6
(d)
5.27
82.5
(e)
0.00
39.2
(f)
0.01
35.2
Cd
(b)
0.06
0.88
(c)
0.11
0.88
(d)
0.64
1.22
(e)
0.21
0.75
(f)
0.04
0.62
Cr
(b)
2.90
18
(c)
1.35
58.7
(d)
1.64
184
(e)
0.92
45.4
(f)
0.02
17.3
Co
(b)
3.44
53.3
(c)
2.55
48.9
(d)
3.99
49.1
(e)
1.64
30.5
(f)
0.74
30.1
(b) = ashing; (c) = 0.3 mol 1-1 HCI; (d) = pH 3 C-D; (e) = pH 7
C-D; (f) = acetic acid
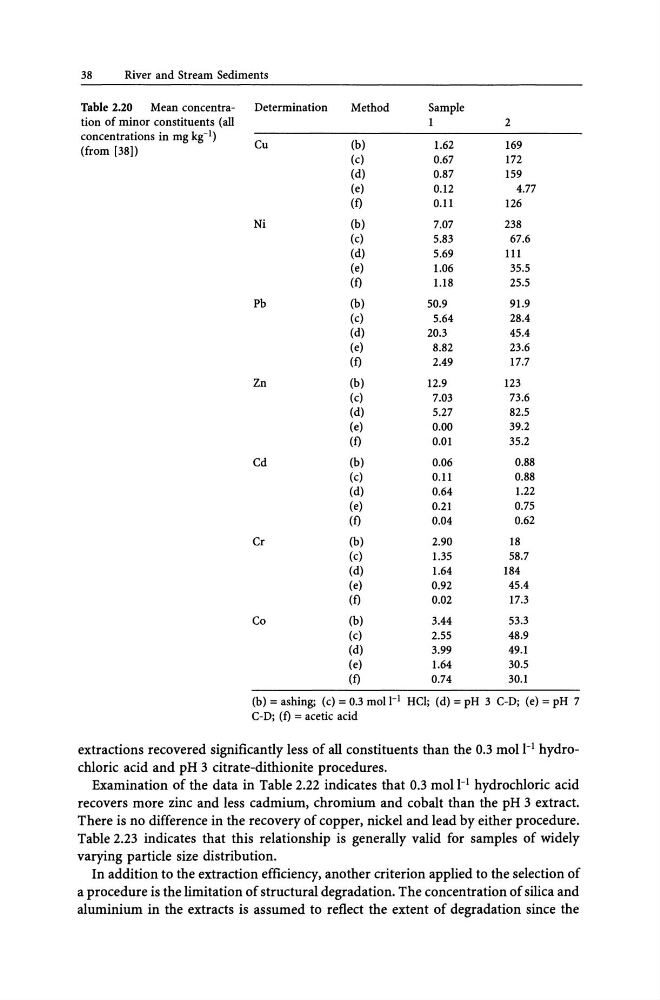
extractions recovered significantly less of all constituents than the 0.3 mol 1-1 hydrochloric acid and pH 3 citrate-dithionite procedures.
Examination of the data in Table 2.22 indicates that 0.3 mol 1-1 hydrochloric acid
recovers more zinc and less cadmium, chromium and cobalt than the pH 3 extract.
There is no difference in the recovery of copper, nickel and lead by either procedure.
Table 2.23 indicates that this relationship is generally valid for samples of widely
varying particle size distribution.
In addition to the extraction efficiency, another criterion applied to the selection of
a procedure is the limitation of structural degradation. The concentration of silica and
aluminium in the extracts is assumed to reflect the extent of degradation since the
River and Stream Sediments
Table 2.20
Mean concentraDetermination
Method
Sample
tion of minor constituents (all
1
2
concentrations in mg kg-I)
Cu
(b)
1.62
169
(from [38])
(c)
0.67
172
(d)
0.87
159
(e)
0.12
4.77
(f)
0.11
126
Ni
(b)
7.07
238
(c)
5.83
67.6
(d)
5.69
III
(e)
1.06
35.5
(f)
1.18
25.5
Pb
(b)
50.9
91.9
(c)
5.64
28.4
(d)
20.3
45.4
(e)
8.82
23.6
(f)
2.49
17.7
Zn
(b)
12.9
123
(c)
7.03
73.6
(d)
5.27
82.5
(e)
0.00
39.2
(f)
0.01
35.2
Cd
(b)
0.06
0.88
(c)
0.11
0.88
(d)
0.64
1.22
(e)
0.21
0.75
(f)
0.04
0.62
Cr
(b)
2.90
18
(c)
1.35
58.7
(d)
1.64
184
(e)
0.92
45.4
(f)
0.02
17.3
Co
(b)
3.44
53.3
(c)
2.55
48.9
(d)
3.99
49.1
(e)
1.64
30.5
(f)
0.74
30.1
(b) = ashing; (c) = 0.3 mol 1-1 HCI; (d) = pH 3 C-D; (e) = pH 7
C-D; (f) = acetic acid
extractions recovered significantly less of all constituents than the 0.3 mol 1-1 hydrochloric acid and pH 3 citrate-dithionite procedures.
Examination of the data in Table 2.22 indicates that 0.3 mol 1-1 hydrochloric acid
recovers more zinc and less cadmium, chromium and cobalt than the pH 3 extract.
There is no difference in the recovery of copper, nickel and lead by either procedure.
Table 2.23 indicates that this relationship is generally valid for samples of widely
varying particle size distribution.
In addition to the extraction efficiency, another criterion applied to the selection of
a procedure is the limitation of structural degradation. The concentration of silica and
aluminium in the extracts is assumed to reflect the extent of degradation since the