

208
Crustacea and Molluscs
spectrometry (Ogata and Miyake [606]) and capillary GC-MS (Ogata and Miyake
[607]) in biota samples after experimental exposure to crude oil suspension.
Moreover, mussels are a well-known biological monitor of marine pollutants in 'the
mussel watch' (Goldberg [608]). Many investigators have reported the susceptibility
of this organism to petroleum hydrocarbons (Lee et al. [609]) and polynuclear aromatic hydrocarbons (Dunn and Young [610]). Kira et al. [611] and Otaga et al. [612] have
identified several organosulphur compounds through GC-MS and measured the levels
of dibenzothiophene, through a GC-flame photometric detector (GC-FPD), in both
mussels and in water of the environment. The calculated concentration ratio of
dibenzothiophene in mussels to that in water ranged up to 500 in the field sample and
800 or higher after an experimental exposure. The estimated biological half-life of
dibenzothiophene from field mussel samples was about 9 days in clean sea water.
Dibenzothiophene levels were measured by gas chromatography-flame photometric detector. In field samples, the levels of dibenzothiophene ranged from less than
0.1 to over 800 Jlg kg-I. Figure 8.8 shows a typical chromatogram of mussel extract by
GC-FPD. Dibenzothiophene was separated clearly from other organosulphur compounds, even under a parts per billion level. The presence of dibenzothiophene was
indicated by simultaneous detection of M + 184 and 186 on the GC-MS single ion
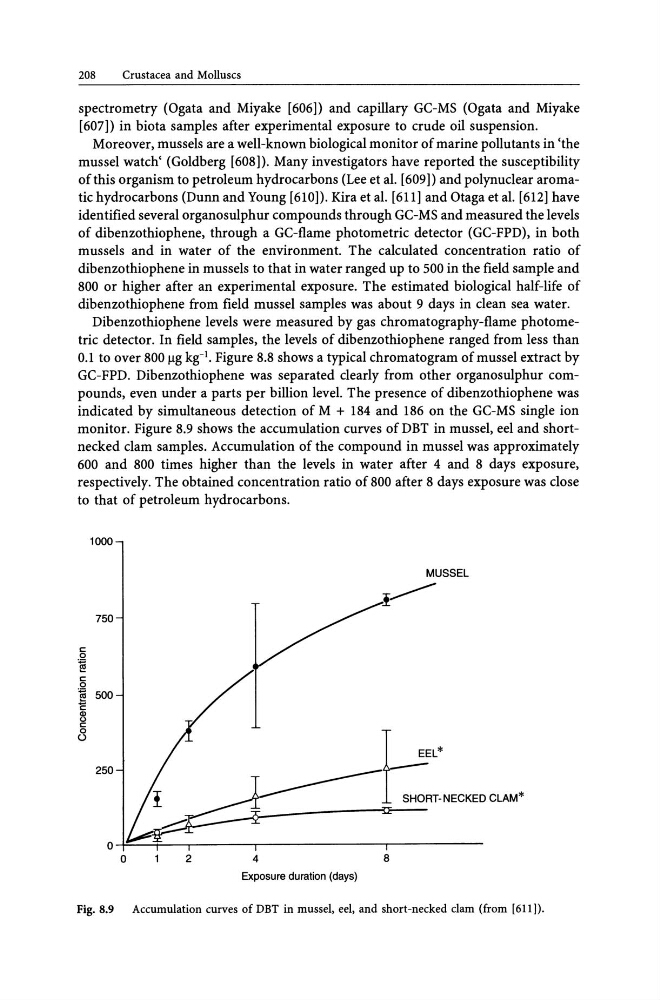
monitor. Figure 8.9 shows the accumulation curves of DBT in mussel, eel and shortnecked clam samples. Accumulation of the compound in mussel was approximately
600 and 800 times higher than the levels in water after 4 and 8 days exposure,
respectively. The obtained concentration ratio of 800 after 8 days exposure was close
to that of petroleum hydrocarbons.
1000
MUSSEL
!~
750
t::
0
~
t::
0
N 500
E Q)
()
t::
0
()
t:
L
'
250
SHORT- NECKED CLAM*
o~~~--,-------,---------------,-----------o
2
4
8
Exposure duration (days)
Fig. 8.9
Accumulation curves of DBT in mussel, eel, and short-necked clam (from [611)).
Crustacea and Molluscs
spectrometry (Ogata and Miyake [606]) and capillary GC-MS (Ogata and Miyake
[607]) in biota samples after experimental exposure to crude oil suspension.
Moreover, mussels are a well-known biological monitor of marine pollutants in 'the
mussel watch' (Goldberg [608]). Many investigators have reported the susceptibility
of this organism to petroleum hydrocarbons (Lee et al. [609]) and polynuclear aromatic hydrocarbons (Dunn and Young [610]). Kira et al. [611] and Otaga et al. [612] have
identified several organosulphur compounds through GC-MS and measured the levels
of dibenzothiophene, through a GC-flame photometric detector (GC-FPD), in both
mussels and in water of the environment. The calculated concentration ratio of
dibenzothiophene in mussels to that in water ranged up to 500 in the field sample and
800 or higher after an experimental exposure. The estimated biological half-life of
dibenzothiophene from field mussel samples was about 9 days in clean sea water.
Dibenzothiophene levels were measured by gas chromatography-flame photometric detector. In field samples, the levels of dibenzothiophene ranged from less than
0.1 to over 800 Jlg kg-I. Figure 8.8 shows a typical chromatogram of mussel extract by
GC-FPD. Dibenzothiophene was separated clearly from other organosulphur compounds, even under a parts per billion level. The presence of dibenzothiophene was
indicated by simultaneous detection of M + 184 and 186 on the GC-MS single ion
monitor. Figure 8.9 shows the accumulation curves of DBT in mussel, eel and shortnecked clam samples. Accumulation of the compound in mussel was approximately
600 and 800 times higher than the levels in water after 4 and 8 days exposure,
respectively. The obtained concentration ratio of 800 after 8 days exposure was close
to that of petroleum hydrocarbons.
1000
MUSSEL
!~
750
t::
0
~
t::
0
N 500
E Q)
()
t::
0
()
t:
L
'
250
SHORT- NECKED CLAM*
o~~~--,-------,---------------,-----------o
2
4
8
Exposure duration (days)
Fig. 8.9
Accumulation curves of DBT in mussel, eel, and short-necked clam (from [611)).