

128
Fish
sulphuric and perchloric acids in the presence of an accurately known amount of
mercury carrier. A preliminary precipitation as mercury sulphide is followed by
further purification, and electrodeposition or precipitation as mercuric oxide to
isolate mercury. The radioactivities due to mercury 196 and mercury 197 are then
measured by scintillation. The errors in this method are S % at the 2 mg kg- 1 mercury
level and IS % at the 0.01 mg kg- 1 level. Standard deviations are, respectively, less
than S % at the S mg kg- 1 level and less than 17 % at the O.oI mg kg-l level. Fish
samples contain both organic and inorganic mercury, predominantly organic. Svasankara-Pillayet al. [382] showed that freeze drying of homogenized fish samples
caused a 16-39 % loss of organic mercury compounds, but did not cause any loss of
inorganic mercury. Similarly, low temperature ashing (Tracerlab ModelSOS asher)
caused an 81-98 % loss of mercury from fish. Exposure of fish samples to Xrays or
neutrons before mercury analysis, to convert volatile organo-mercury compounds to
inorganic mercury, reduced mercury losses to 4.5-16.4 % but did not eliminate them.
Low temperature (60°C) oven drying caused up to 72 % losses of volatile mercury
from fish. As a consequence of these findings, Svasankara-Pillay et al. [382] decided
that it was good practice, before analysis, not to preprocess fish samples to limit their
bulk or to reduce their water content, and not to store samples in containers that
adsorb mercury onto their surfaces. The procedure they adopted was to keep the
samples frozen until use. They were then homogenized using a blender and / or a
grinder made of stainless steel or borosilicate glass. The portion of sample for neutron
activation analysis was then vacuum sealed in a polyethylene bag.
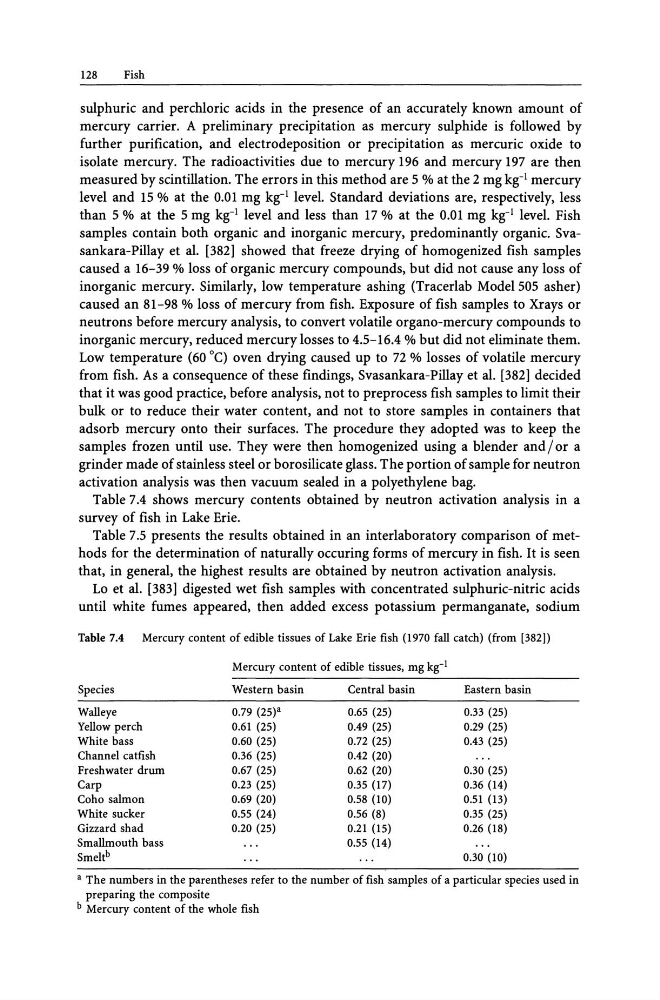
Table 7.4 shows mercury contents obtained by neutron activation analysis in a
survey of fish in Lake Erie.
Table 7.S presents the results obtained in an interlaboratory comparison of methods for the determination of naturally occuring forms of mercury in fish. It is seen
that, in general, the highest results are obtained by neutron activation analysis.
Lo et al. [383] digested wet fish samples with concentrated sulphuric-nitric acids
until white fumes appeared, then added excess potassium permanganate, sodium
Table 7.4
Mercury content of edible tissues of Lake Erie fish (1970 fall catch) (from [382])
Mercury content of edible tissues, mg kg- 1
Species
Western basin
Central basin
Eastern basin
Walleye
0.79 (25)"
0.65 (25)
0.33 (25)
Yellow perch
0.61 (25)
0.49 (25)
0.29 (25)
White bass
0.60 (25)
0.72 (25)
0.43 (25)
Channel catfish
0.36 (25)
0.42 (20)
Freshwater drum
0.67 (25)
0.62 (20)
0.30 (25)
Carp
0.23 (25)
0.35 (17)
0.36 (14)
Coho salmon
0.69 (20)
0.58 (10)
0.51 (13)
White sucker
0.55 (24)
0.56 (8)
0.35 (25)
Gizzard shad
0.20 (25)
0.21 (15)
0.26 (18)
Smallmouth bass
0.55 (14)
Smelt b
0.30 (10)
" The numbers in the parentheses refer to the number of fish samples of a particular species used in
preparing the composite
b Mercury content of the whole fish
Fish
sulphuric and perchloric acids in the presence of an accurately known amount of
mercury carrier. A preliminary precipitation as mercury sulphide is followed by
further purification, and electrodeposition or precipitation as mercuric oxide to
isolate mercury. The radioactivities due to mercury 196 and mercury 197 are then
measured by scintillation. The errors in this method are S % at the 2 mg kg- 1 mercury
level and IS % at the 0.01 mg kg- 1 level. Standard deviations are, respectively, less
than S % at the S mg kg- 1 level and less than 17 % at the O.oI mg kg-l level. Fish
samples contain both organic and inorganic mercury, predominantly organic. Svasankara-Pillayet al. [382] showed that freeze drying of homogenized fish samples
caused a 16-39 % loss of organic mercury compounds, but did not cause any loss of
inorganic mercury. Similarly, low temperature ashing (Tracerlab ModelSOS asher)
caused an 81-98 % loss of mercury from fish. Exposure of fish samples to Xrays or
neutrons before mercury analysis, to convert volatile organo-mercury compounds to
inorganic mercury, reduced mercury losses to 4.5-16.4 % but did not eliminate them.
Low temperature (60°C) oven drying caused up to 72 % losses of volatile mercury
from fish. As a consequence of these findings, Svasankara-Pillay et al. [382] decided
that it was good practice, before analysis, not to preprocess fish samples to limit their
bulk or to reduce their water content, and not to store samples in containers that
adsorb mercury onto their surfaces. The procedure they adopted was to keep the
samples frozen until use. They were then homogenized using a blender and / or a
grinder made of stainless steel or borosilicate glass. The portion of sample for neutron
activation analysis was then vacuum sealed in a polyethylene bag.
Table 7.4 shows mercury contents obtained by neutron activation analysis in a
survey of fish in Lake Erie.
Table 7.S presents the results obtained in an interlaboratory comparison of methods for the determination of naturally occuring forms of mercury in fish. It is seen
that, in general, the highest results are obtained by neutron activation analysis.
Lo et al. [383] digested wet fish samples with concentrated sulphuric-nitric acids
until white fumes appeared, then added excess potassium permanganate, sodium
Table 7.4
Mercury content of edible tissues of Lake Erie fish (1970 fall catch) (from [382])
Mercury content of edible tissues, mg kg- 1
Species
Western basin
Central basin
Eastern basin
Walleye
0.79 (25)"
0.65 (25)
0.33 (25)
Yellow perch
0.61 (25)
0.49 (25)
0.29 (25)
White bass
0.60 (25)
0.72 (25)
0.43 (25)
Channel catfish
0.36 (25)
0.42 (20)
Freshwater drum
0.67 (25)
0.62 (20)
0.30 (25)
Carp
0.23 (25)
0.35 (17)
0.36 (14)
Coho salmon
0.69 (20)
0.58 (10)
0.51 (13)
White sucker
0.55 (24)
0.56 (8)
0.35 (25)
Gizzard shad
0.20 (25)
0.21 (15)
0.26 (18)
Smallmouth bass
0.55 (14)
Smelt b
0.30 (10)
" The numbers in the parentheses refer to the number of fish samples of a particular species used in
preparing the composite
b Mercury content of the whole fish